
%201.webp)
.avif)
.avif)
When you look closely at your customer data, one thing becomes clear fast: retention shapes revenue more than most people realize. Even a small 5% lift in retention can increase profitability by 25 to 95%. With that kind of impact, retention becomes one of the most powerful levers in your entire customer lifecycle.
Your retention rate shows how many customers stay with you after their first purchase and how well your customer experience encourages them to return. This guide breaks down the customer retention rate formula, shows you how to calculate it, provides strategies to improve it, and more.
At a glance:
- Customer retention rate (CRR) shows how many existing customers stay with your brand and is one of the clearest indicators of long-term growth.
- Use the formula ((End Customers − New Customers) ÷ Starting Customers) × 100 to calculate true retention without inflating numbers.
- A “good” retention rate depends heavily on industry, with benchmarks ranging from about 30% in ecommerce to more than 80% in services and subscription-driven categories.
- Retention improves with consistent actions like personalizing experiences, strengthening loyalty value, smoothing friction, and recovering at-risk customers early.
- Supporting metrics like RPR, churn, CLV, purchase frequency, NPS, and AOV give deeper insight into customer behavior and loyalty drivers.
- Nector boosts retention with a customizable loyalty program, built-in personalization, smart rewards, and automated tools that fuel repeat purchases.
What Is Customer Retention Rate?
Customer retention rate (CRR) is the percentage of customers who continue buying from your brand over a specific period. It reflects how effectively you’re holding on to the customers you already worked hard (and paid) to acquire.
Brands track retention rate because it’s one of the clearest indicators of sustainable growth.
- A high CRR means customers return on their own and contribute more revenue without additional acquisition spend.
- A low CRR signals potential gaps in your product experience, loyalty strategy, or post-purchase engagement.
Customer retention rate is often confused with churn rate, but they measure opposite outcomes. Retention tells you how many customers stayed; churn tells you how many left. Together, they give a complete picture of customer loyalty and brand health.
Your retention rate ultimately shows whether your brand is building lasting customer relationships or constantly starting from zero.
How the Customer Retention Rate Formula Works
The standard formula for calculating customer retention rate is:
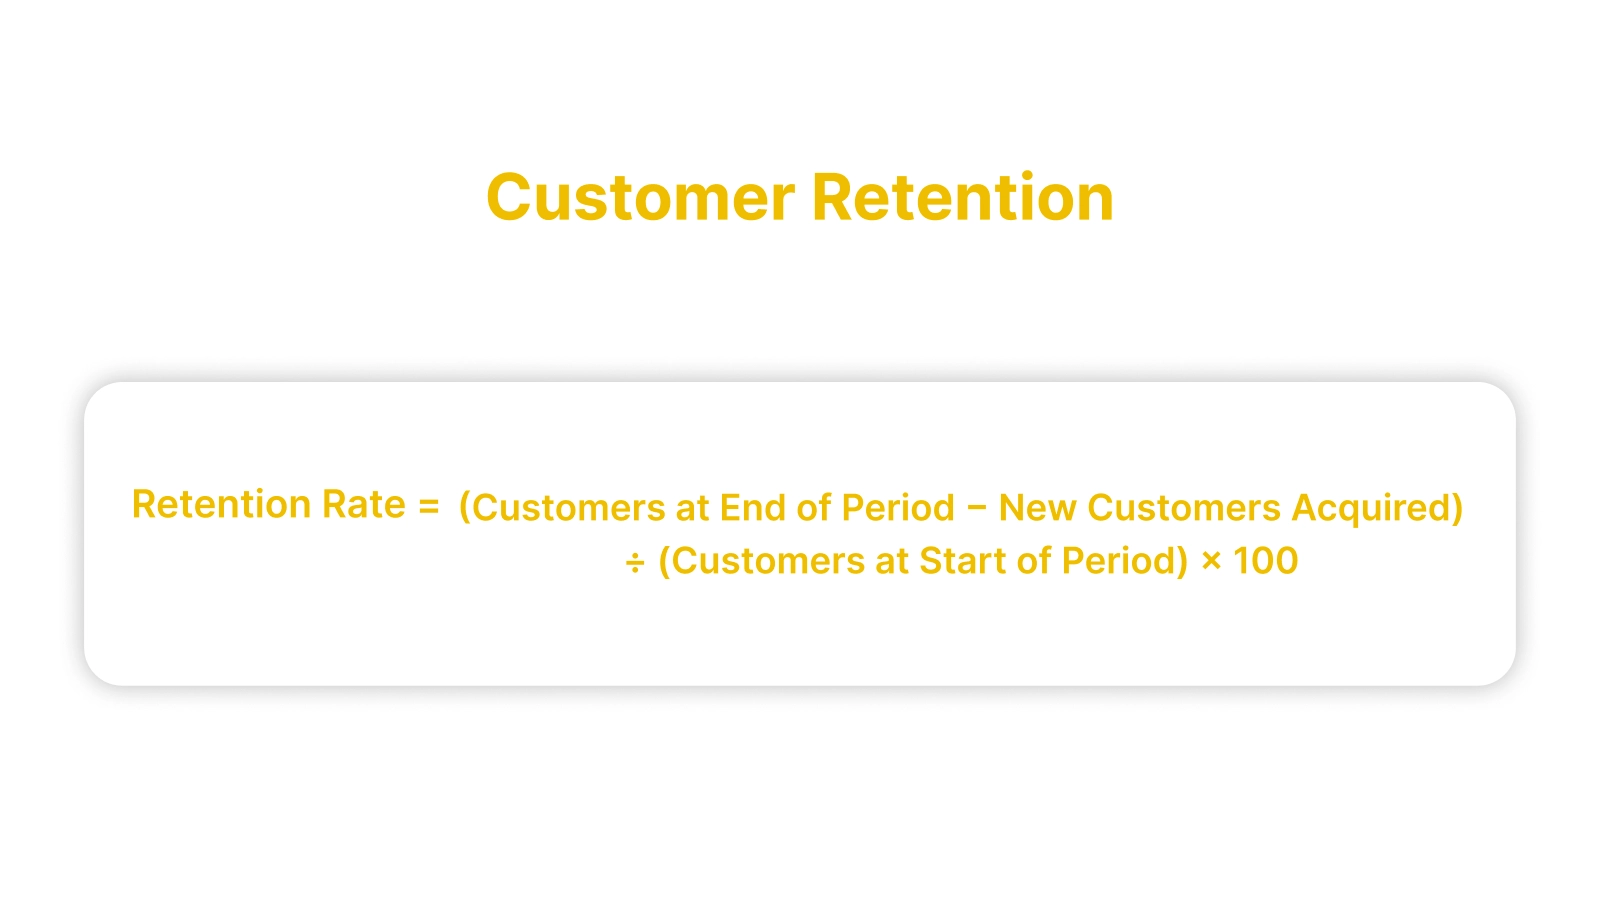
Here’s what each part means:
- Customers at Start of Period: How many customers you had at the beginning of the time frame you’re measuring.
- Customers at End of Period: How many customers you still have at the end of that same period.
- New Customers Acquired: How many first-time customers joined during that period. These are removed from the calculation, so you’re only measuring how many existing customers stayed with you.
This formula gives you a percentage that reflects how well your brand is retaining the customers it already has.
How to Calculate Customer Retention Rate
To calculate your customer retention rate, you only need three numbers: how many customers you started with, how many you ended with, and how many of those were new. The goal is to isolate how many existing customers stayed with you.
Follow these steps:
- Identify the number of customers at the start of the period.
- Note how many customers you have at the end of the period.
- Subtract the new customers acquired during that time.
- Divide the result by the number of customers you started with and multiply by 100.
For example:
You start the month with 1,000 customers. By the end of the month, you have 1,200 customers. During the month, 300 of them are new.
Plugging these into the formula:
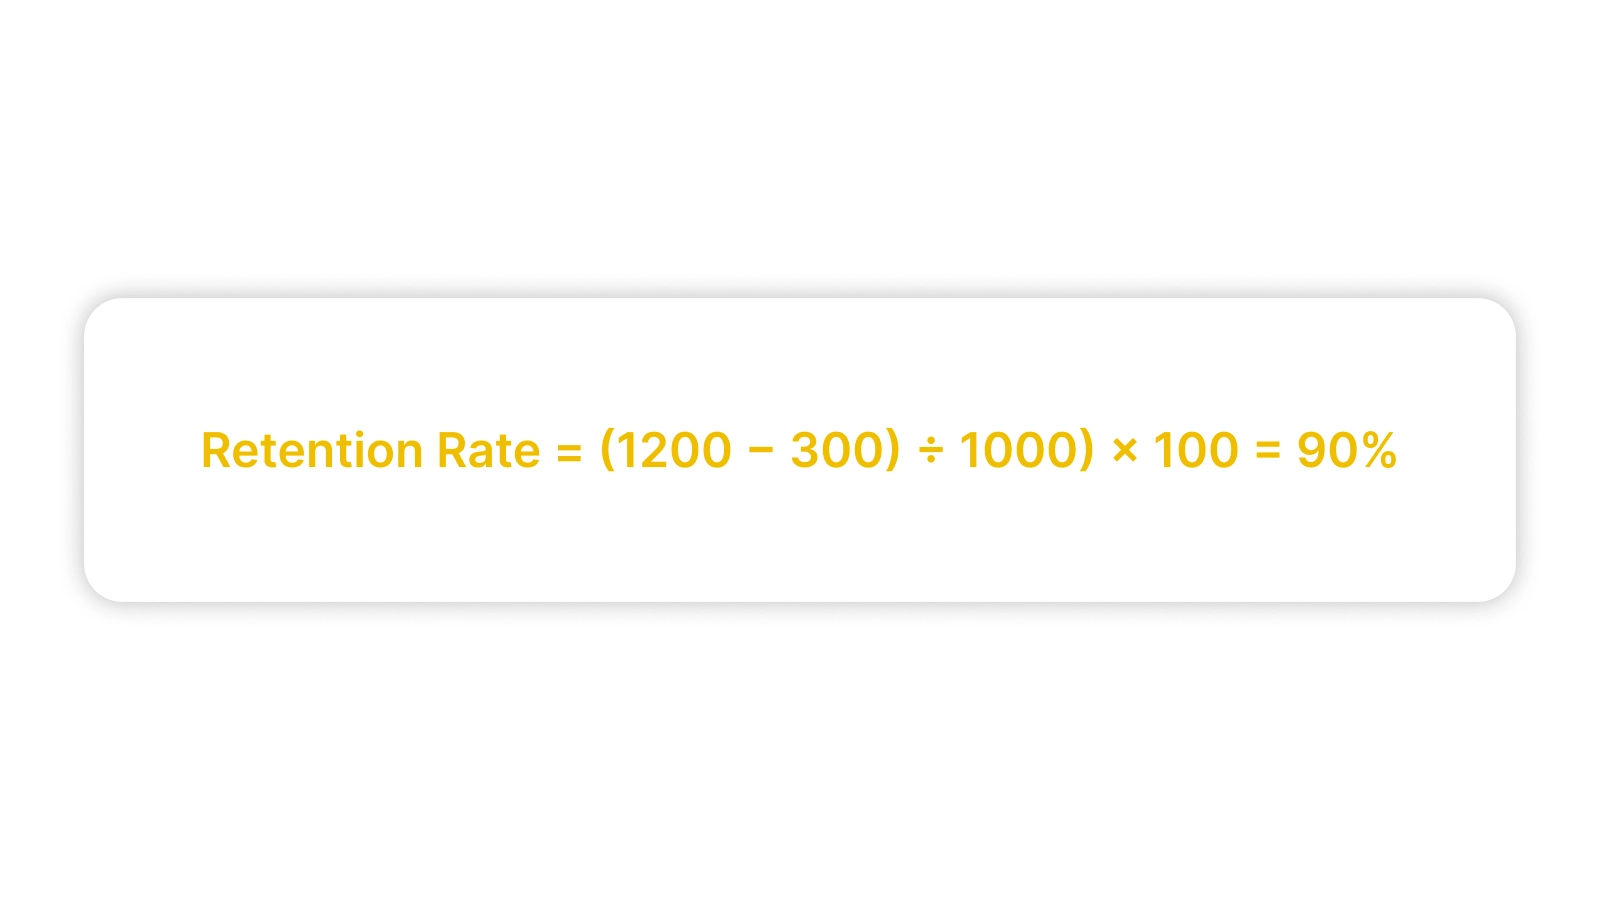
A 90 per cent retention rate shows that the majority of your existing customers continued buying from you during the period, which is a strong indicator of healthy retention.
Before you rely on this number, watch out for a few common mistakes that can distort your retention rate:
- Counting new customers as retained customers: Retention measures who stayed, not who joined. Always remove new customers from the calculation.
- Mixing different time windows: Comparing a monthly rate with a quarterly or annual rate creates misleading trends.
- Overlooking churn within the period: Retention only reflects who is left at the end. Customers who left mid-period will not show up unless you track churn separately.
- Using one blended retention rate for all customers: High-value, subscription, and one-time customers behave very differently. Segmenting reveals real patterns.
- Confusing customer retention with revenue retention: Revenue retention includes expansion or contraction. Customer retention tracks people, not spend.
- Calculating retention too infrequently: Waiting for annual totals hides early warning signs. Monthly or quarterly tracking is more actionable.
Getting this calculation right ensures you’re tracking the real story behind customer loyalty, not an inflated or incomplete number.
Found gaps in your retention rate? Nector gives you the loyalty features needed to close them and keep customers coming back.

What Counts as a Good Customer Retention Rate? (Industry Benchmarks)
A “good” customer retention rate depends heavily on your industry and how often customers are expected to buy. Most consumer brands fall somewhere between 60 and 80%, while subscription and service-based businesses often benchmark higher.
Here are the average customer retention rates by industry:
Source: Shopify’s Average Customer Retention Rate by Industry
These numbers make one thing clear: “good” depends on your category and purchase frequency.
High-frequency or contract-driven industries naturally see higher retention because customers interact with the brand regularly. Categories like e-commerce or hospitality face lower retention simply because customers have more alternatives and buy less predictably.
The best benchmark is often your own trend line. If your retention rate improves quarter over quarter and performs in line with similar brands, you’re on the right track.
How to Improve Your Customer Retention Rate
Improving customer retention requires a series of consistent, thoughtful actions that keep customers engaged, valued, and coming back. Here are some of the most effective ways brands strengthen retention:
.webp)
1. Strengthen the Value Loop
Customers return when they feel the value of staying with your brand increases over time. A value loop reinforces that every interaction, whether a purchase, referral, or engagement, leads to something better.
Without this, every order feels like a one-off transaction instead of part of a long-term relationship.
What you can do:
- Build a loyalty program that rewards frequent purchases and meaningful actions.
- Use tiers or milestones so customers can see progress and feel motivated to keep moving up.
- Ensure rewards are genuinely useful, not symbolic. Customers should feel a real advantage in staying loyal.
What this improves:
- Repeat purchase rate
- Customer stickiness
- Progression toward long-term loyalty
2. Personalize the Customer Journey
Retention improves when customers feel understood. Personalization reduces the effort required from the customer. They do not have to search for what they want, and they receive communication that aligns with their timing and preferences. Irrelevant messaging reduces trust and engagement.
Ways to put this into practice:
- Segment customers based on behavior such as purchase frequency, category interest, recency, and spend.
- Use these segments to time campaigns around customer needs, such as replenishment cycles or new categories they might explore.
- Personalize incentives so customers feel the offer is designed for them rather than sent to everyone.
What this improves:
- Customer engagement
- Conversion on repeat orders
- Efficiency and ROI of marketing campaigns
3. Deliver a Great Post-Purchase Experience
Retention is often won or lost after the first purchase. Customers want reassurance that they made the right decision.
A thoughtful post-purchase experience builds trust, reduces doubt, and increases the likelihood of a second order, which is the strongest predictor of long-term loyalty.
What to implement:
- Send clear delivery updates to reduce uncertainty.
- Provide usage guides, care tips, or tutorials to help customers get the best outcome from the product.
- Follow up after delivery to ask about their experience or request feedback.
What this improves:
- Second-order rate
- Review quality and customer feedback
- Early-stage churn
4. Remove Friction Across the Buying Experience
Customers do not churn only because of major issues. They leave after repeated small inconveniences such as slow checkout, unclear shipping details, or limited payment options. Reducing these pain points makes buying effortless and improves retention.
How to simplify the experience:
- Streamline checkout and remove unnecessary steps.
- Offer multiple payment methods and delivery options.
- Make returns transparent, simple, and customer-friendly.
What this improves:
- Checkout completion rate
- Drop-off and abandonment rates
- Overall customer satisfaction
5. Turn Happy Customers Into Advocates
Advocates are extremely valuable because they bring in new customers who convert faster, stay longer, and deliver higher lifetime value. Turning satisfied buyers into advocates strengthens retention for both the referrer and the referred customer.
How to activate advocacy:
- Trigger referral prompts after positive moments such as reviews, repeat purchases, or loyalty tier upgrades.
- Make sharing simple through one-click links or built-in sharing options.
- Use Nector’s Referral Program to automate advocacy with dual-sided rewards, built-in fraud protection, and easy performance tracking across your store.
What this improves:
- Quality of new customer acquisition
- Retention of both referrers and referred customers
- Customer acquisition cost (CAC) efficiency
6. Identify and Recover At-Risk Customers Early
Churn is predictable. Customers show signs such as reduced purchase frequency, fewer site visits, or lower engagement long before they leave. Identifying these signals early allows you to intervene when recovery is still possible.
Recovery actions to take:
- Track expected purchase cycles and flag deviations.
- Monitor engagement trends or loyalty point activity to detect declining interest.
- Send tailored win-back messages or offers aligned to their previous purchases.
What this improves:
- Churn rate
- Recovery and win-back performance
- Predictability and stability of revenue from existing customers
Together, these actions create a retention system that keeps customers engaged at every stage of their journey.
Also read: Increasing Customer Retention and Advocacy Strategies
10 Additional Metrics to Track Alongside Retention Rate
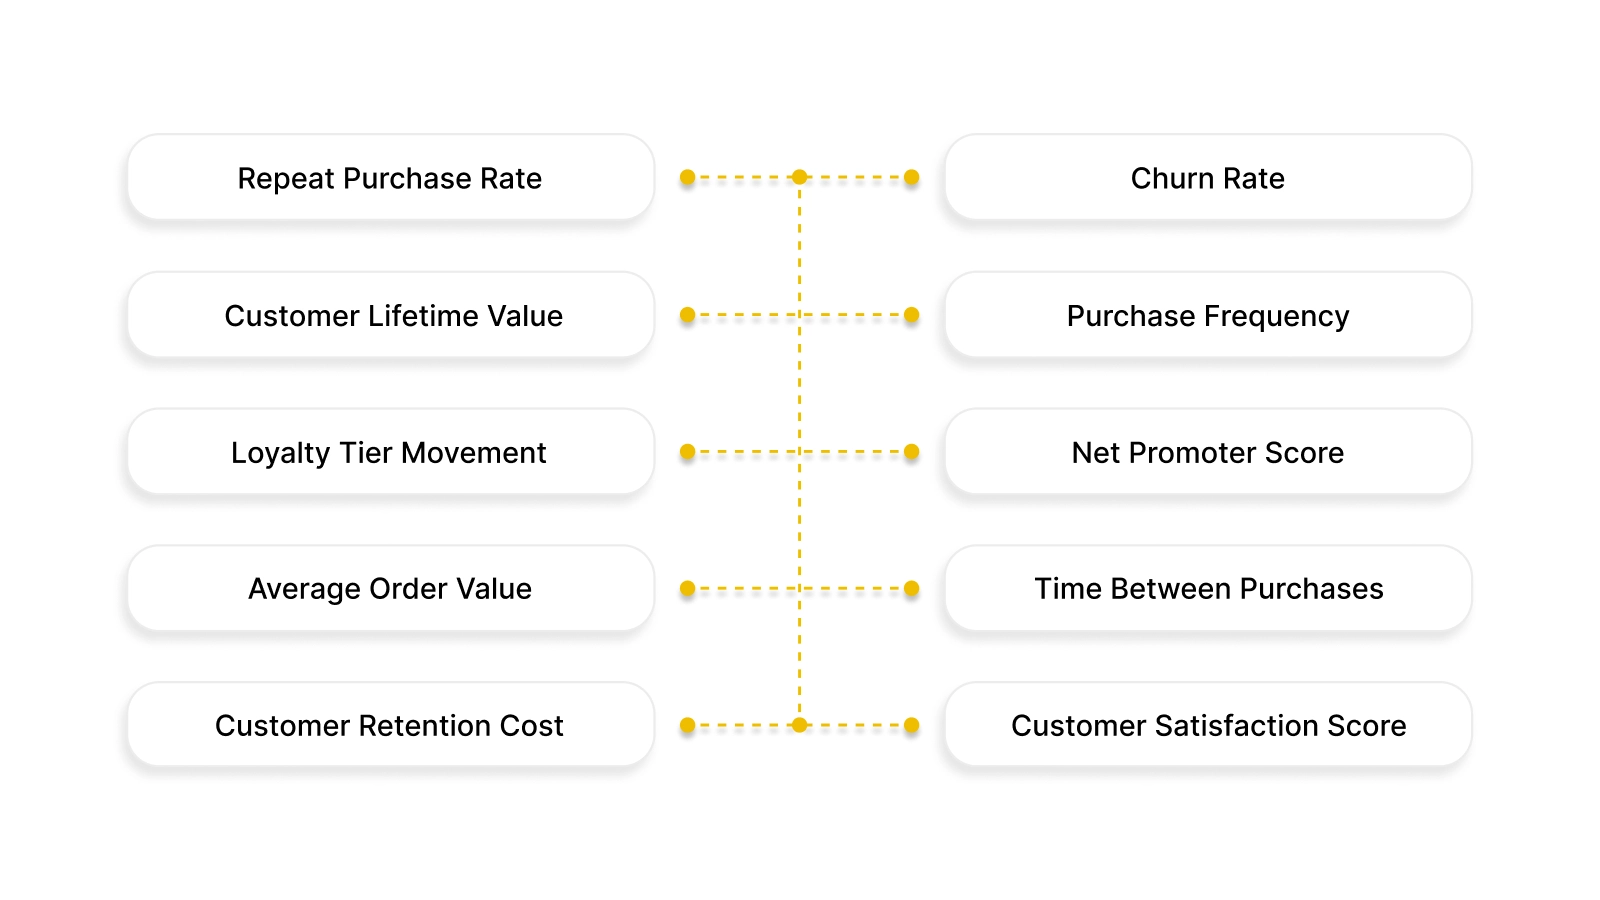
Retention rate gives you a solid high-level view, but it cannot explain the quality of your customer base, the momentum of your repeat purchases, or the health of your long-term loyalty.
These ten supporting metrics fill in the gaps.
1. Repeat Purchase Rate (RPR)
In ecommerce, the second purchase is often the hardest to win. RPR shows how many customers return for another purchase after their first one.
Why it matters: If customers never make a second purchase, retention stalls before it starts.
Formula:
Repeat Purchase Rate = (Number of Repeat Customers ÷ Total Customers) × 100
2. Churn Rate
Indicates the share of customers who stop buying from you during a specific period. Churn highlights how quickly or steadily you are losing customers and whether certain segments are leaving faster than others.
Why it matters: You cannot improve retention without understanding the pace and pattern of customer loss.
Formula:
Churn Rate = (Customers Lost During Period ÷ Customers at Start of Period) × 100
3. Customer Lifetime Value (CLV)
CLV represents the total revenue a customer is expected to generate throughout their entire relationship with your brand. It shows the deeper financial impact of your retained customers.
Why it matters: High retention is meaningful only if customers generate strong lifetime value.
Formula:
CLV = Average Order Value × Purchase Frequency × Customer Lifespan
Also read: Customer Lifetime Value SaaS: Calculate & Grow CLV
4. Purchase Frequency
Shows how often customers buy within a given timeframe. Frequent purchasing indicates strong engagement and lower churn risk.
Why it matters: Higher frequency means customers return naturally without heavy marketing pushes.
Formula:
Purchase Frequency = Total Orders ÷ Total Unique Customers
5. Loyalty Tier Movement
A compass for loyalty engagement. Changes in tiers reveal whether customers are deepening their relationship with your brand or starting to lose interest.
Why it matters: Tier progression highlights growing loyalty, while stalled or downward movement helps identify customers who may need re-engagement.
How to track it:
Monitor how many customers:
- Move up a tier
- Maintain their current tier
- Drop to a lower tier
6. Net Promoter Score (NPS)
NPS measures customer sentiment and willingness to recommend your brand. It captures how customers feel about your brand at a macro level, not just specific transactions.
Why it matters: High NPS often correlates with stronger retention, repeat purchases, and organic referrals.
Formula:
NPS = % Promoters − % Detractors
7. Average Order Value (AOV)
Some customers spend more because they see more value. AOV reveals whether your catalog encourages that behavior.
Why it matters: AOV compounds retention value. Customers who stay longer and spend more deliver significantly stronger unit economics.
Formula:
AOV = Total Revenue ÷ Total Number of Orders
8. Time Between Purchases (TBP)
Shows the average number of days between one purchase and the next. This metric tells you whether customer buying cycles are tightening or widening.
Why it matters: A shorter gap between purchases signals growing engagement, increasing gaps often predict churn.
Formula:
Time Between Purchases = Sum of (Days Between Purchases for Each Customer) ÷ Number of Customers
9. Customer Retention Cost (CRC)
CRC reflects how much you spend to keep an existing customer active. This includes loyalty rewards, retention campaigns, support efforts, and retention tools.
Why it matters: Retention should be more cost-effective than acquisition. CRC helps ensure your strategy drives ROI.
Formula:
CRC = Total Retention Spend ÷ Number of Customers Retained
Retention spend includes loyalty rewards, retention campaigns, customer support costs, and retention-focused tools.
10. Customer Satisfaction Score (CSAT)
Captures how satisfied customers are with a specific interaction, delivery, product usage moment, or support experience.
Why it matters: Low satisfaction in key touchpoints often leads to churn. High satisfaction builds trust and increases repeat purchase likelihood.
Formula:
CSAT = (Number of Satisfied Responses ÷ Total Responses) × 100
Tracking these metrics gives you clarity. However, the real impact comes from taking action, and Nector gives brands the infrastructure to do it at scale.
Strengthen Retention With Nector, the Smarter Loyalty System
Building strong retention requires more than discounts or generic rewards. Customers come back when the experience feels valuable, personal, and effortless across every touchpoint.
Nector is built specifically for this, a smart and customizable loyalty platform that turns one-time buyers into long-term repeat customers. It powers retention for 1,000+ brands by making loyalty deeply integrated, fully on-brand, and easy to run at scale.
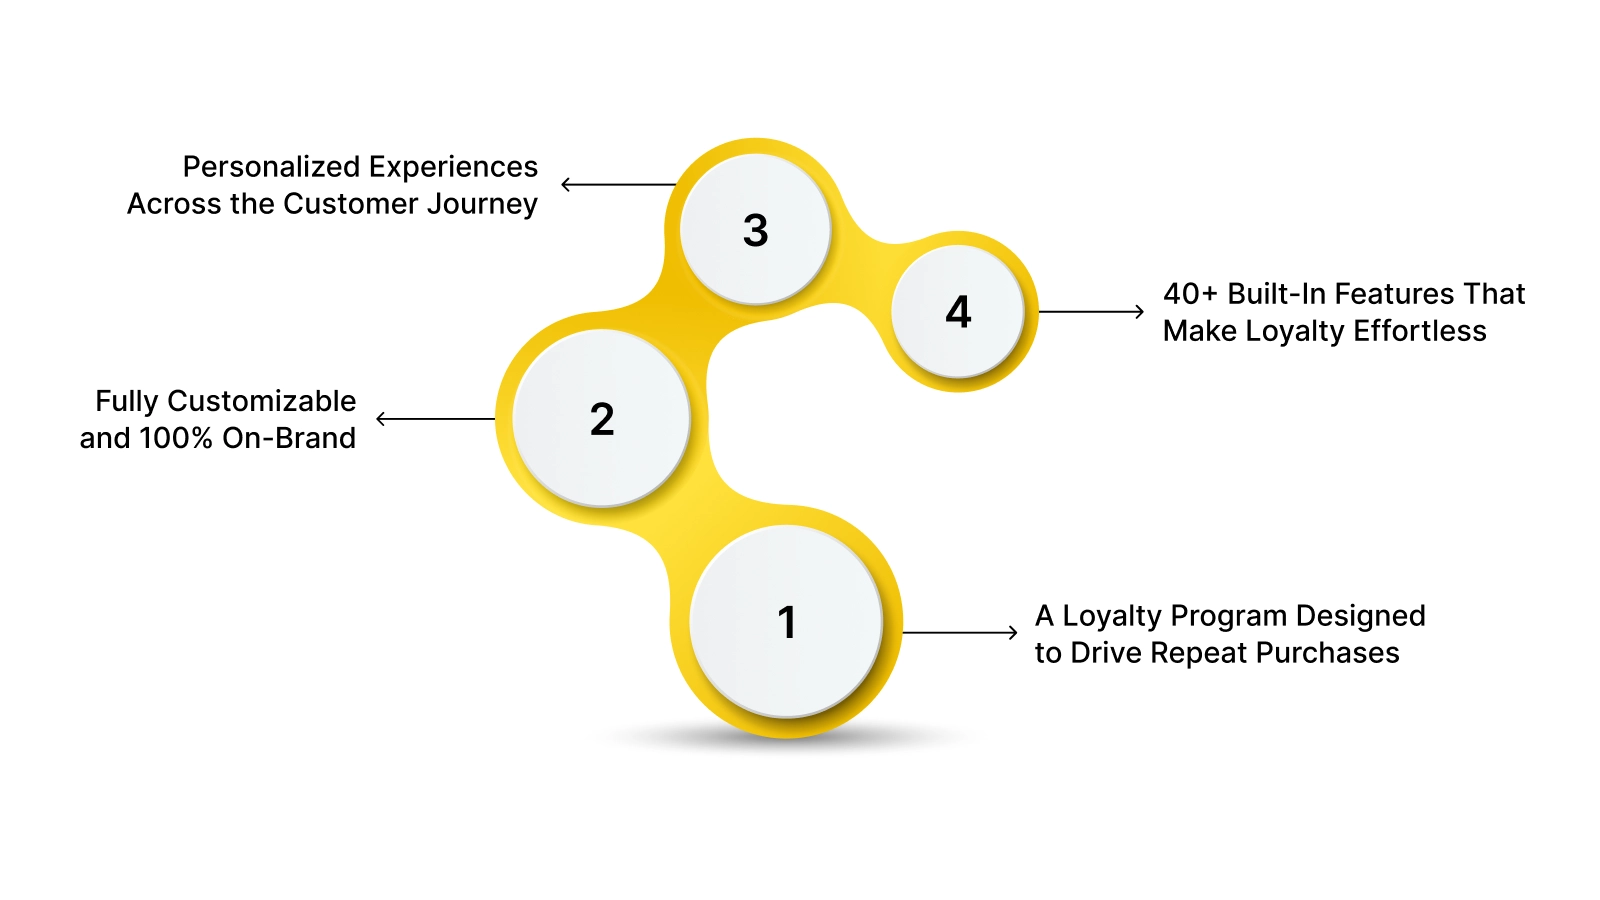
Key Features:
- A Loyalty Program Designed to Drive Repeat Purchases: Nector’s gamified loyalty system rewards purchases, engagement, and referrals to build repeat buying habits. Every customer becomes a loyalty member automatically through Shopify sync.
- Fully Customizable and 100% On-Brand: Create a loyalty experience that matches your brand’s look, feel, and tone. Customize points, rewards, tiers, and UI without writing a single line of code.
- Personalized Experiences Across the Customer Journey: Nector showcases rewards on PDPs, checkout, and thank-you pages, and adapts loyalty flows based on behavior, order history, and your tech stack integrations.
- 40+ Built-In Features That Make Loyalty Effortless: From points redemption at checkout to VIP tiers, coin expiry, bonuses, and store credit refunds, Nector gives you all the tools needed to drive retention from day one.
Stronger retention comes from consistent, rewarding experiences that bring customers back. Nector makes this easy to deliver and scale. Sign up to start building a smarter loyalty program today.
Wrapping Up
Once you understand what drives your retention rate, improving it becomes far more manageable. Clear metrics reveal where customers stay engaged and where they drift away, and even small improvements can create meaningful gains in profitability.
The real impact comes when you turn those insights into better experiences, stronger value loops, and easier repeat purchases.
Nector helps you bring all of that together with a loyalty platform built to support ongoing engagement at every stage of the customer journey.
FAQs
What is the KPI for customer retention?
The main KPI is the customer retention rate (CRR). Supporting KPIs include repeat purchase rate, churn rate, and customer lifetime value (CLV).
What is the formula for retention rate in Excel?
Use: =((End_Customers - New_Customers) / Start_Customers) * 100, replacing each variable with the correct cell reference.
What is a good customer retention rate?
It varies by industry. Ecommerce averages around 30%, while subscription and service categories often reach 70–85%.
What are the three R's of customer retention?
Retention, Repeat, and Referral: keeping customers longer, driving repeat purchases, and turning customers into advocates.


_2_11zon.avif)
Start Building Customer Retention That Lasts

