
%201.webp)
.avif)
.avif)
Most businesses create customer journey maps with good intentions, but often end up with vague, unused diagrams. The real goal is to build one that reveals actionable insights, especially since 74% of customers expect better personalization when they share more data, 73% as technology advances, and 64% when they spend more.
An effective map pinpoints where customers disengage and connects their emotions to your internal processes. This turns feedback into a clear plan to meet rising expectations.
In this guide, we provide ten specific, ready-to-use customer experience journey map examples across key industries. You will see how to structure maps that diagnose problems and prescribe solutions. These frameworks help you identify where to apply resources and tools like loyalty incentives for maximum impact.
Quick Look
- They move beyond vague "improve CX" goals to identify exact friction points, like cart abandonment or trial drop-off.
- 80% of customers say experience is as important as product.
- 74% expect better personalization for sharing data; 73% as tech advances.
- Use a detailed grid for operations, a visual timeline for stakeholders, or an empathy map for UX design.
- The most insightful maps track customer feelings and connect them to your internal teams and systems.
- A good map prescribes clear next steps, such as automating a follow-up email or triggering a retention reward.
What Makes a Good Customer Journey Map?
A high-quality map serves as a practical diagnostic tool rather than a static design project that your marketing department creates and then ignores.
To add real value, especially given that 80% of customers say the experience a company provides is as important as its products and services, your map must connect the customer’s external actions with your internal operational processes and specific business goals for growth.
You should focus on creating a living document that your team can update as your product evolves or as customer expectations shift.
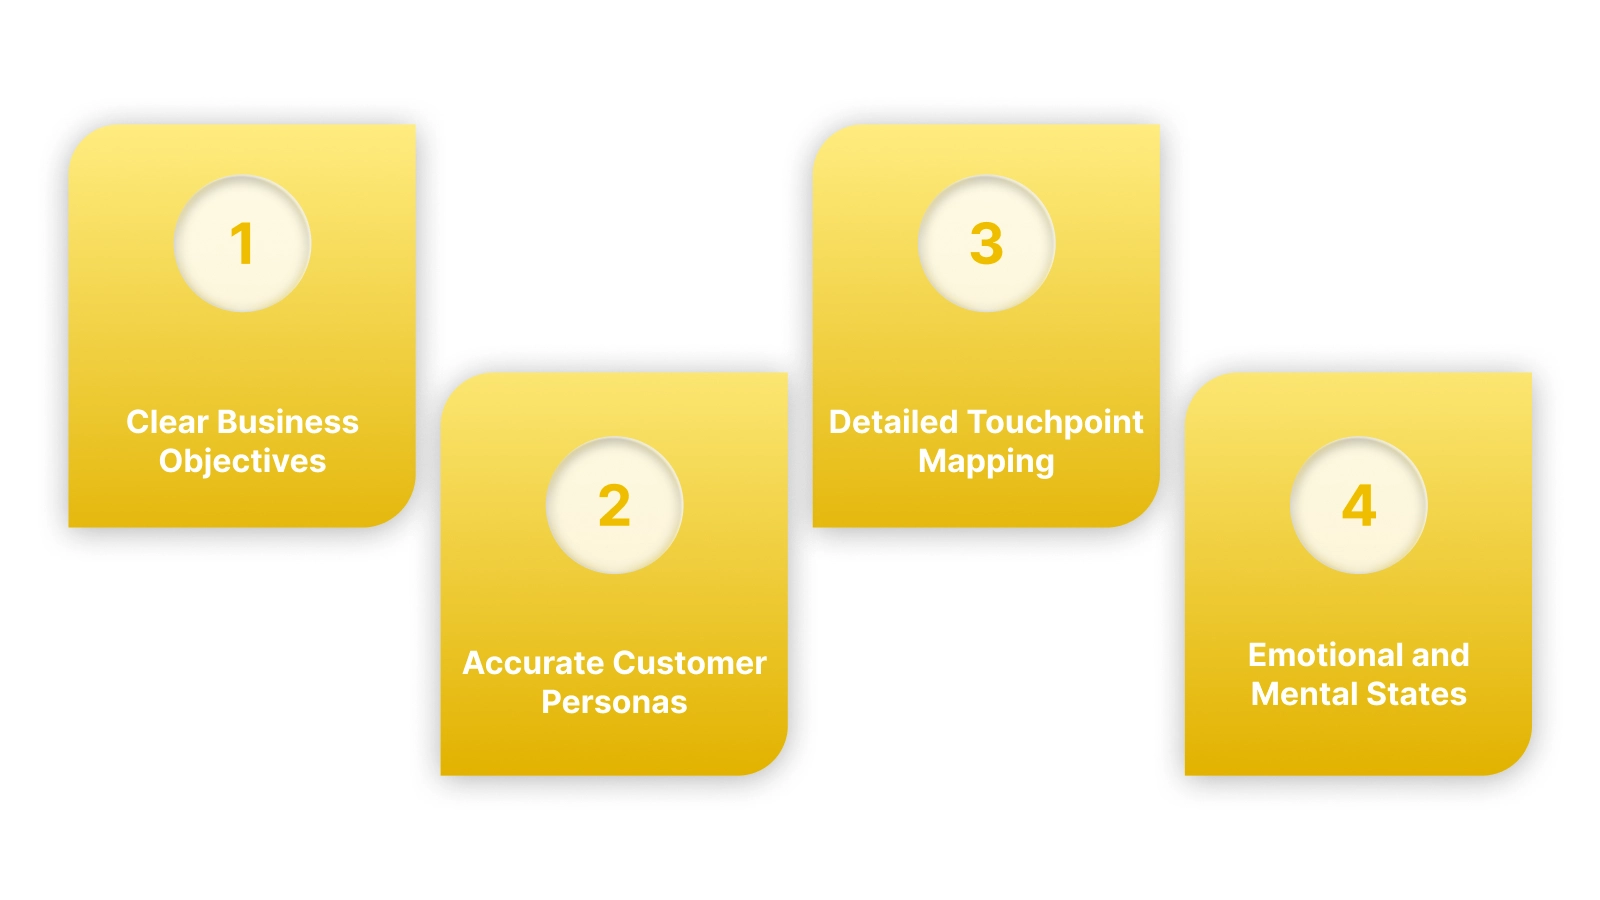
To build an effective visualization, you must include these foundational elements in every map your team creates:
1. Clear Business Objectives
You should anchor every map to a specific goal, such as reducing churn or increasing the adoption of a new product feature. Without a clear goal, your journey map will become too broad and fail to provide the actionable insights your team needs.
2. Accurate Customer Personas
You must base your maps on real data from your actual customers rather than using generic assumptions about who is buying your products. Use purchase history and support tickets to build a profile that reflects the real motivations and frustrations of your most active users.
3. Detailed Touchpoint Mapping
A good map lists every interaction point, including your website, social media ads, email notifications, and even the physical packaging of your items. Identifying these points allows you to see where the communication might break or where the customer might feel overwhelmed by too much information.
4. Emotional and Mental States
You need to document how a customer feels at each stage, whether they are feeling excited, confused, or anxious about their purchase decision. Understanding these emotions helps your team design better messages that reassure the customer and move them closer to the final checkout stage.
With this framework in mind, you can adapt the approach to any business model. The following examples show how this structure applies in practice.
A map identifies the friction, but you need a system to fix it. See how Nector acts as the action layer for your journey, turning identified touchpoints into automated rewarding moments. Book a demo to learn more.
Also read: Integrated Loyalty Systems: Setup Guide for Online Stores
Ecommerce: The "Omnichannel Retail" Customer Journey Map Examples
This example is ideal for D2C brands that sell on Shopify but also have a social media presence. It tracks a customer who discovers a product online but may have questions before buying. The map focuses on creating a seamless flow from discovery to unboxing.
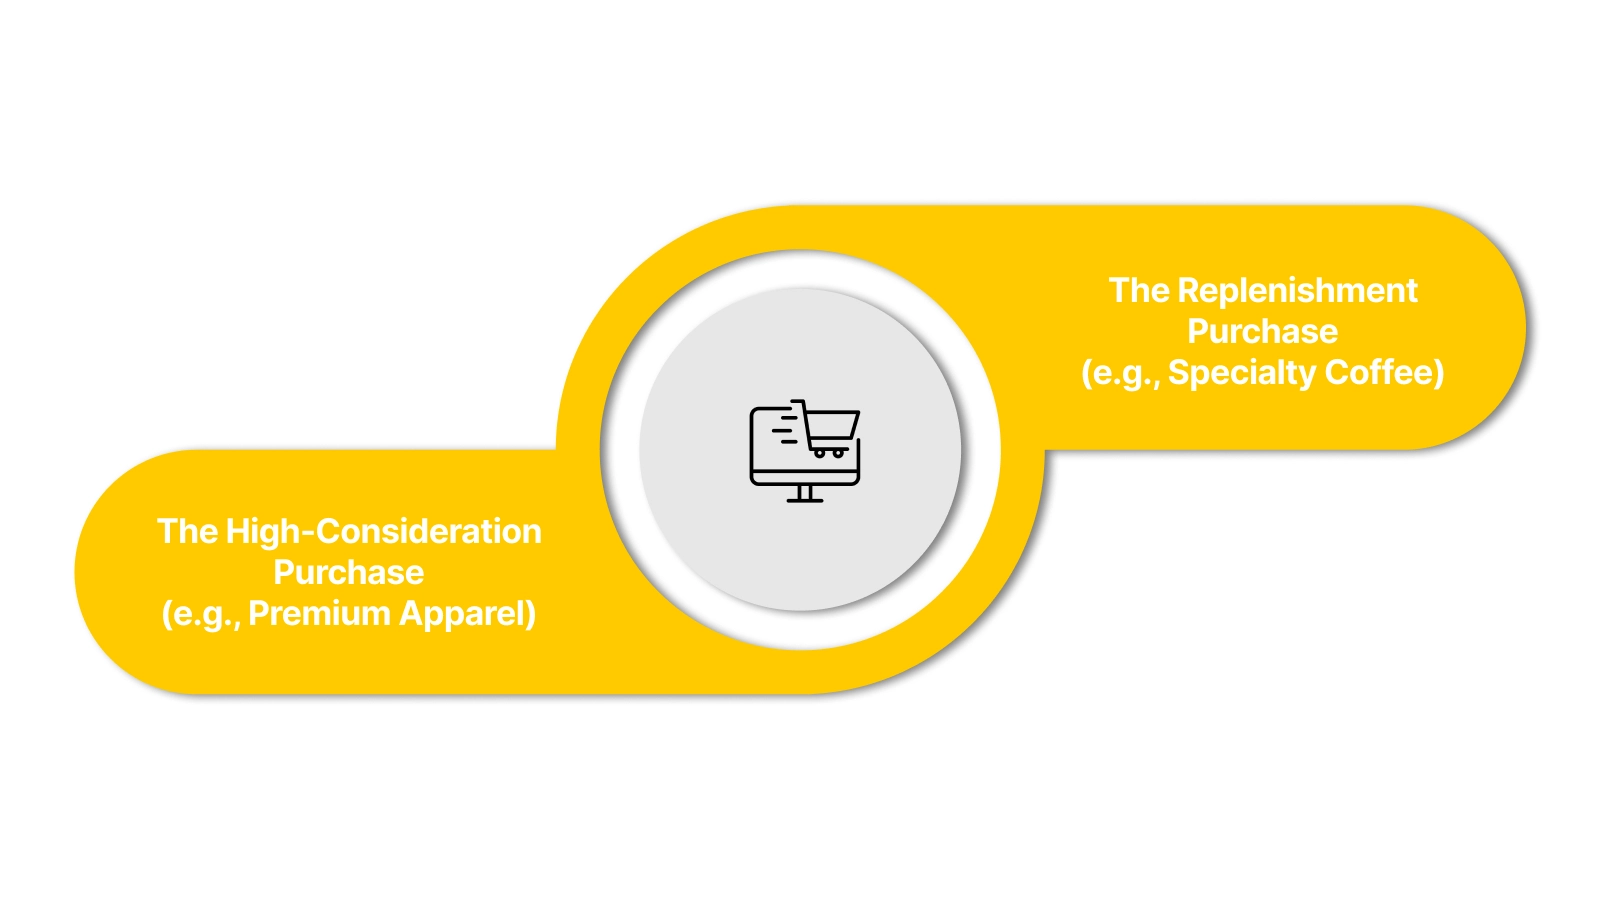
Example 1: The High-Consideration Purchase (e.g., Premium Apparel)
- Key Focus: Reducing hesitation during the consideration phase for higher-priced items.
- The "Moment of Truth": The post-purchase period where shipping anxiety can lead to buyer's remorse and returns.
- Detailed Breakdown:
- Touchpoints: Instagram Story Ad → Product Page → Size Guide Chatbot → Abandoned Cart Email → Order Confirmation.
- Customer Emotion: Curiosity → Interest → Uncertainty/Confusion → Reassurance → Anticipation → Anxiety.
- The Outcome: Analysis showed that unclear size information was a major blocker. The brand added a live chat option on the product page and automated post-purchase shipping updates, reducing related support tickets by 30%.
Example 2: The Replenishment Purchase (e.g., Specialty Coffee)
- Key Focus: Encouraging predictable, repeat purchases by automating the replenishment cycle.
- The "Moment of Truth": The "last bag" alert that triggers a repurchase before the customer runs out.
- Detailed Breakdown:
- Touchpoints: Google Search → Subscription Offer Page → First Delivery → "Your coffee is brewing" Email → "Time to Restock" SMS.
- Customer Emotion: Need → Evaluation → Satisfaction → Habit Formation → Prompted Action.
- The Outcome: The brand identified a 3-day "habit gap" after the last bag was opened. They automated a loyalty points bonus for subscribers who reorder within that window, increasing subscriber retention by 22%.
These maps highlight that the post-purchase phase is just as critical as the path to checkout. For subscription services, the journey extends far beyond the first sale.
SaaS: The "Free Trial to Pro" Onboarding Customer Journey Map Examples
In software, the journey truly begins at sign-up. This map tracks how a user moves from a curious visitor to an engaged, paying customer by achieving their first "Aha!" moment quickly.
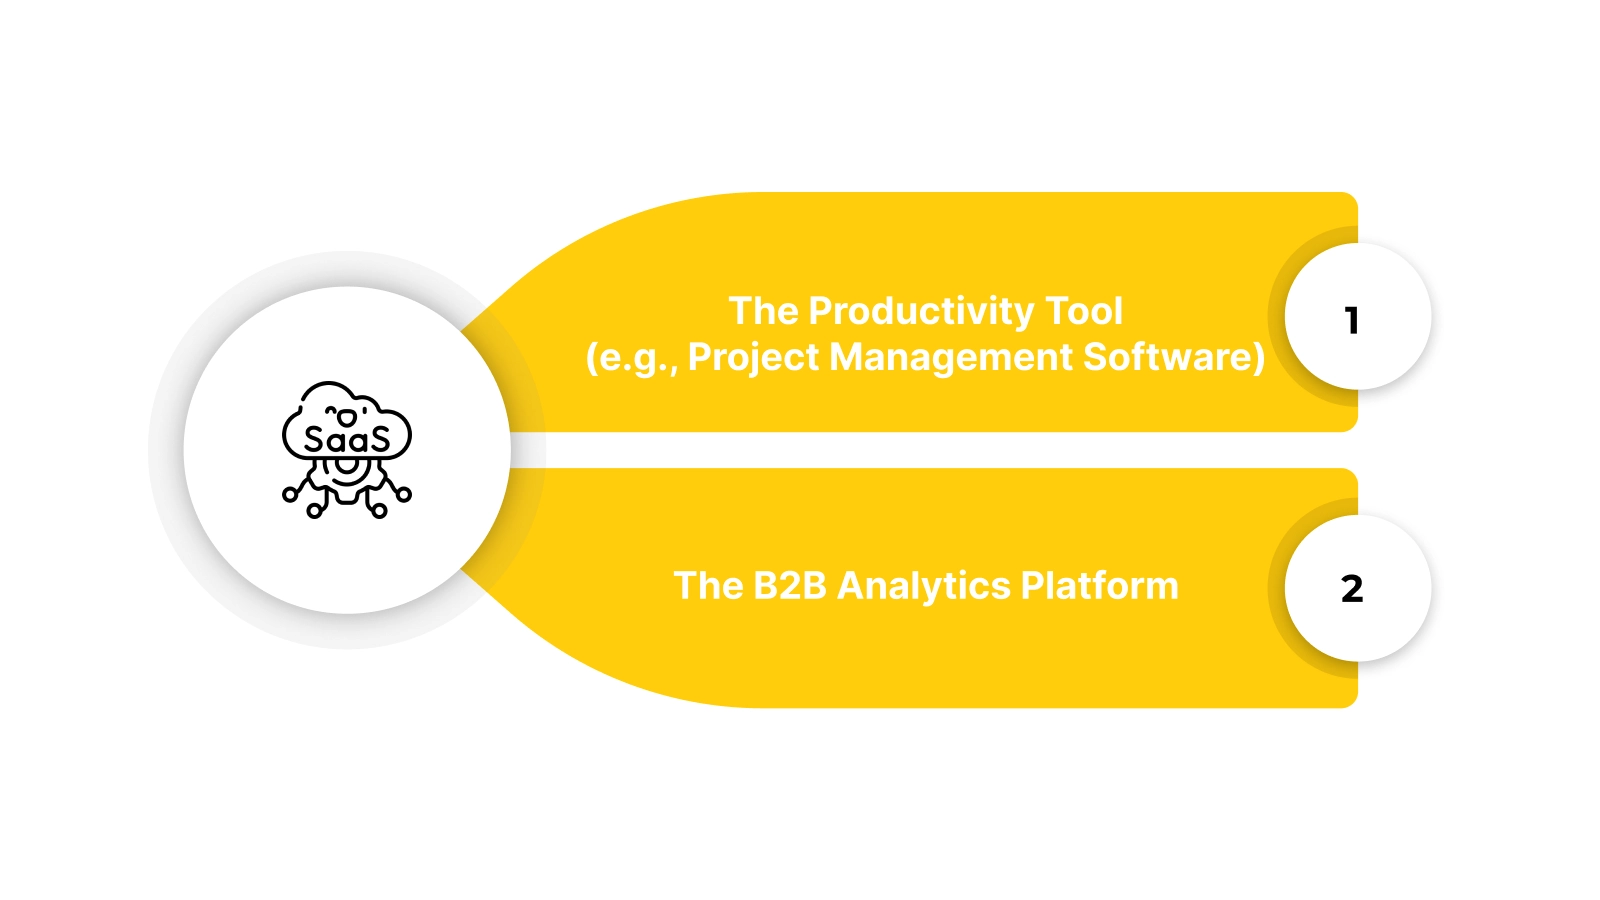
Example 3: The Productivity Tool (e.g., Project Management Software)
- Key Focus: Accelerating Time-to-Value (TTV) to prove the tool's worth before the trial ends.
- The "Moment of Truth": The user's first successful project creation and task assignment within the app.
- Detailed Breakdown:
- Touchpoints: Blog Article (problem-focused) → Free Trial Sign-up → Interactive Welcome Tour → "First Project" Template → Onboarding Success Email.
- Customer Emotion: Frustration (with current tools) → Hope → Overwhelm → Guided Confidence → Achievement.
- The Outcome: The map revealed users stalled at the blank project dashboard. Introducing pre-filled template options decreased time to first project creation by 70% and improved trial-to-paid conversion.
Example 4: The B2B Analytics Platform
- Key Focus: Managing multi-stakeholder approval and demonstrating clear ROI during the trial.
- The "Moment of Truth": The user generates and shares their first actionable report with a colleague.
- Detailed Breakdown:
- Touchpoints: Demo Request → Team Pilot Setup → Data Connection Guide → Report Dashboard → ROI Calculator Tool.
- Customer Emotion: Research Mode → Evaluation → Technical Hesitation → Clarity → Validation.
- The Outcome: IT security concerns were a major friction point. Creating a dedicated, easy-to-follow security FAQ page for trial users reduced setup drop-off by 25%.
While SaaS focuses on guiding individual users, B2B journeys must account for the complex dynamics of team-based purchasing decisions.

Also read: Customer Retention Automation Assistant: Tools & Strategies
B2B: The "Complex Decision-Maker" Customer Journey Map Examples
Unlike B2C, the B2B journey involves multiple stakeholders with different priorities. This map tracks the lengthy consideration phase, focusing on building trust and mitigating perceived risk across various departments.
Example 5: The Enterprise Software Purchase
- Key Focus: Navigating a long sales cycle with layers of technical, financial, and user approval.
- The "Moment of Truth": The security review and the procurement contract negotiation.
- Detailed Breakdown:
- Touchpoints: Industry Whitepaper → Conference Meeting → Technical Deep-Dive Demo → Security Audit Docs → Pilot Program → Executive Business Case.
- Stakeholder Emotions:
- End-User: Needs efficiency, fears disruption.
- IT Manager: Needs security/compliance, fears integration complexity.
- CFO: Needs a clear ROI, fears budget overrun.
- The Outcome: The sales team was focused on end-user features but was losing deals at the CFO stage. They developed a standardized ROI simulator, shortening the final approval time by an average of two weeks.
Example 6: The Marketing Agency Service Purchase
- Key Focus: Building confidence in strategic expertise and proving past results.
- The "Moment of Truth": The proposal presentation and the defined success metrics (KPIs).
- Detailed Breakdown:
- Touchpoints: Case Study Portfolio → Initial Strategy Call → Custom Proposal → Reference Call → Contract Onboarding.
- Customer Emotion: Need for Expertise → Vetting → Alignment Check → Trust Building → Commitment.
- The Outcome: Prospects were unsure how results would be tracked. Agencies that started including a "Measurement & Reporting" appendix in proposals saw a higher close rate and clearer project launches.
B2B journeys are defined by multi-threaded conversations. In other industries, like healthcare, the emotional weight of the journey itself becomes the primary factor to manage.
Healthcare: The "Patient Experience" Customer Journey Map Examples
This example highlights the intense emotional overlay of a service journey. In healthcare, stress, uncertainty, and urgency define the customer's mindset, making clarity and empathy non-negotiable.
Example 7: The Elective Procedure Pathway (e.g., Cosmetic Clinic)
- Key Focus: Managing anxiety and setting realistic expectations throughout a planned procedure.
- The "Moment of Truth": The consultation and the immediate post-procedure recovery period.
- Detailed Breakdown:
- Touchpoints: Website Research → Consultation → Pre-Op Instructions → Procedure Day → Post-Op Care Calls → Follow-up Check.
- Customer Emotion: Hope/Anxiety → Reassurance → Preparation → Trust → Discomfort/Concern → Relief.
- The Outcome: Post-op anxiety calls were overwhelming the staff. Implementing a scheduled, automated SMS check-in system (e.g., "How is Day 3 recovery? Reply NEED HELP or DOING OK") efficiently triaged patient concerns and improved satisfaction scores.
Example 8: The Diagnostic Testing Journey
- Key Focus: Reducing the fear of the unknown during the waiting period for test results.
- The "Moment of Truth": The period between taking a test and receiving results, and the manner in which results are delivered.
- Detailed Breakdown:
- Touchpoints: Doctor's Order → Lab Scheduling → Sample Collection → Waiting Period → Results Delivery (Portal/Call) → Next Steps Guidance.
- Customer Emotion: Worry → Procedural Focus → Anxious Waiting → Apprehension → Clarity/New Emotions.
- The Outcome: The generic "results are ready" portal notification caused significant stress. Clinics that added context like "Your results have been reviewed by your doctor and are now available with next-step notes" saw a decrease in frantic follow-up calls.
Whether managing anxiety or routine care, healthcare maps reveal that communication is the core treatment. For subscription businesses, the map's priority shifts entirely to predicting and preventing departure.
Also read: Loyalty Pricing: How to Apply and Understand Its Importance
Subscription Services: The "Retention & Churn Recovery" Map
For subscription services, the initial sign-up is just the entry point. This map focuses on the ongoing "danger zones" where engagement drops and customers silently decide to cancel.
Example 9: The Media Streaming Service
- Key Focus: Identifying "content fatigue" and re-engaging users before they cancel.
- The "Moment of Truth": The "Pause Subscription" button click and the subsequent retention offer.
- Detailed Breakdown:
- Touchpoints: Binge-Watch Period → Decline in Logins → "We Miss You" Email → Personalized Show Recommendation → Pause/Cancel Flow → Incentive Offer.
- Customer Emotion: High Engagement → Waning Interest → Forgetting → Prompted Recall → Decision Point → Re-evaluation.
- Nector Integration Point: When the system detects a "Dead Zone" (no login for 21 days), it can trigger an automated email with a loyalty reward, like double points for watching a new featured show, to incentivize re-engagement.
- The Outcome: By targeting the "Decline in Logins" phase with personalized content rewards instead of waiting for a cancel attempt, services can reduce passive churn.
When your map identifies a "Danger Zone," you need to act fast. Use Nector to trigger automated loyalty points or re-engagement rewards the moment a customer’s interest begins to wane. Schedule a demo to see how it works.
Example 10: The Meal Kit Delivery Service
- Key Focus: Managing weekly decision fatigue and making the "skip a week" option feel guilt-free to prevent cancellation.
- The "Moment of Truth": The weekly menu selection deadline and the "Skip" or "Cancel" decision.
- Detailed Breakdown:
- Touchpoints: Weekly Menu Preview → Selection Deadline Reminder → "Skip This Week" Flow → Delivery Day → Cooking Experience → Feedback Prompt.
- Customer Emotion: Anticipation → Choice Overload → Pressure → Relief (if skipping is easy) → Satisfaction (if cooking) → Feedback.
- Nector Integration Point: If a customer skips two weeks in a row, the system can automatically issue bonus points or a small discount on their next order to encourage re-activation, treating the skip as a pause, not a step toward churn.
- The Outcome: Making the "skip" process effortless and following up with a re-engagement incentive turned skippers into longer-term subscribers than those who felt forced to cancel.
Each of these map types serves a different primary purpose. Choosing the right format is key to getting the insights you need.
Which Journey Map Format Is Right for You?
Your goal determines the best structure for your map. The wrong format can obscure insights instead of revealing them.
Here’s what you need to know:
Different formats serve different purposes, so you should choose the one that best fits your current business objective and the team involved.
Also read: How to Use Incentives for Engaged Customers to Drive Loyalty?
3 Simple Steps to Apply These Examples to Your Business
Seeing these examples is only the first step; you must apply these structures to your specific operational workflows to see measurable results. A journey map that sits in a file and is never used will not help you improve your customer retention or sales.
You should use these maps as a foundation for making real changes to your marketing campaigns and your product development roadmap. Move from visualization to execution by following these three strategic steps to improve your brand’s customer experience:
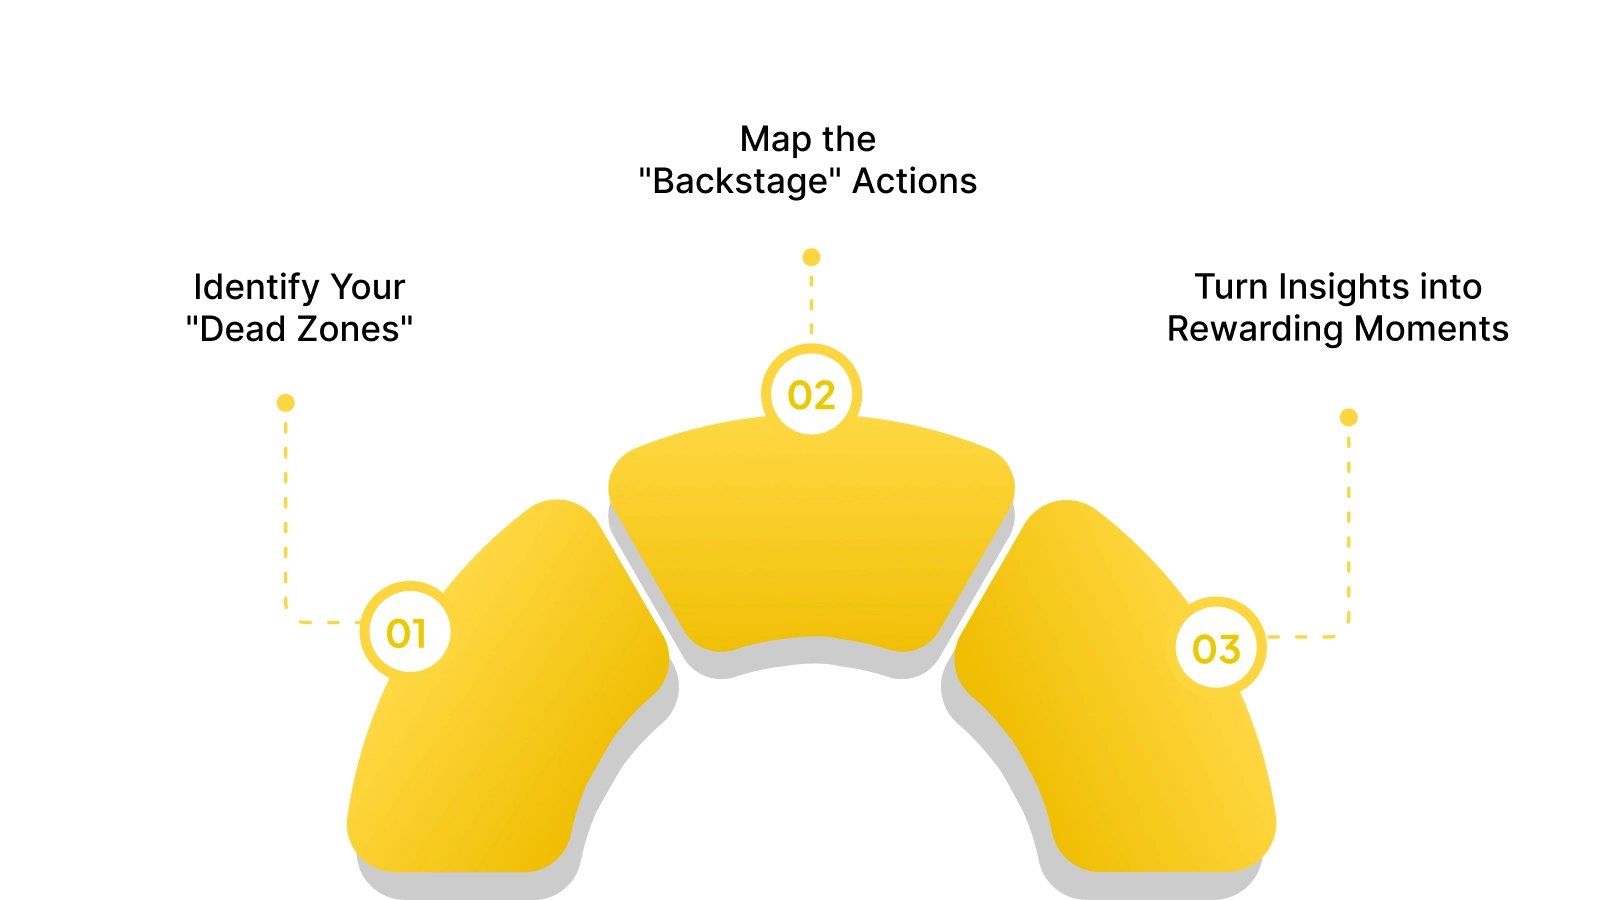
Step 1: Identify Your "Dead Zones"
You should look for parts of the journey where nothing is happening, such as a lack of follow-up after a support ticket is closed. These silences are where customers are most likely to drop off because they feel ignored or undervalued by your brand.
Step 2: Map the "Backstage" Actions
A great journey map shows what your team does behind the scenes to support each customer interaction, such as warehouse fulfillment or server maintenance. If a customer is frustrated by slow updates, your map should show which internal team is responsible for that specific communication delay.
Step 3: Turn Insights into Rewarding Moments
Once you find a friction point, you should fix it with a targeted incentive, such as a discount or a loyalty point bonus. For example, if customers hesitate during the consideration stage, you can trigger a "first-purchase reward" to encourage them to complete the transaction.
By following these steps, you turn your journey map into a living strategy that directly contributes to your company’s revenue and customer satisfaction scores.
Turning Journey Maps into Action with Nector
Manually acting on journey map insights is not scalable. Teams cannot personalize rewards or sync data across tools without automation, so insights often go unused.
Nector operationalizes your strategy. It serves as the action layer that executes personalized incentives at the exact moments your map identifies, turning analysis into retention tactics.
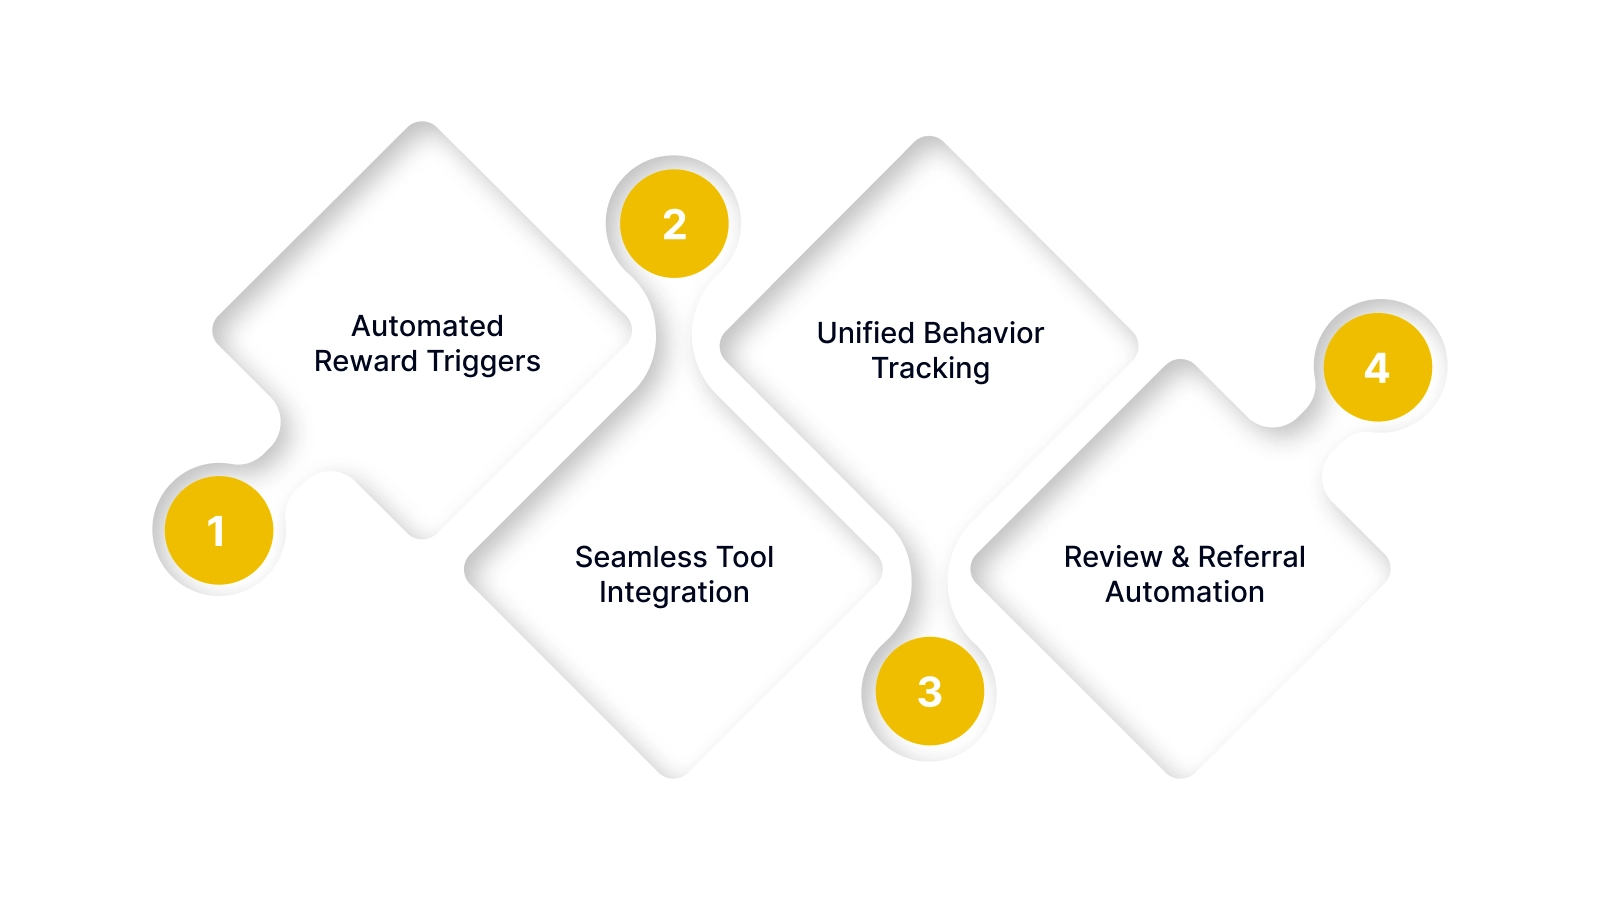
- Automated Reward Triggers: Set rules to automatically issue points or coupons when customers hit key journey milestones (first purchase, 90-day anniversary) or enter danger zones (cart abandonment, 30-day inactivity).
- Seamless Tool Integration: Sync loyalty data with your email platform (Klaviyo/Mailchimp) to send communications based on a customer's real-time point balance or VIP tier, not just generic broadcast rules.
- Unified Behavior Tracking: Combine actions like purchases, reviews, and referrals into a single customer profile. This gives you a complete view of engagement across the journey to inform better segmentation and targeting.
- Review & Referral Automation: Automatically request and reward post-purchase reviews to build social proof. Power referral programs that turn satisfied customers into advocates at the peak of their experience.
A platform like Nector ensures the strategic interventions defined in your journey maps can be deployed consistently and automatically, without creating manual work for your team.
Also read: Digital Reward Options for Employees and Customers
Conclusion
A customer experience journey map is a powerful diagnostic tool, but its true value is measured by the actions it inspires. The examples and frameworks provided here move you from abstract visualization to concrete strategy, highlighting exactly where to invest effort for maximum retention impact.
Nector simplifies this process by providing the automation layer that brings your journey strategy to life. It allows you to reward and re-engage customers at the critical touchpoints you identify, turning insights into a systematic growth engine.
Ready to close the gap between customer insight and actionable retention strategy? Book a demo with Nector to see how to automate personalized experiences across your entire customer journey.
Frequently asked questions
What is the difference between a journey map and a marketing funnel?
A marketing funnel is linear and focused solely on conversion, guiding a prospect to a sale. A journey map is non-linear and focuses on the entire lifecycle experience, including post-purchase support, loyalty, and emotions.
How many personas should I map?
Start with your single most important customer persona. Perfect the journey for your primary segment before mapping secondary ones. Trying to map multiple personas at once often leads to generic, ineffective maps.
What tools are best for tracking the data in a journey map?
Combine analytics platforms (Google Analytics for behavior), CRM systems (for touchpoint history), and survey tools (for emotion/feedback). The goal is to blend quantitative data (click rates) with qualitative insights (survey responses).
How often should I update a customer journey map?
Review and update your core journey map at least twice a year. Update it immediately after any major change to your product, service, or website to ensure it still reflects the real customer experience.