
%201%20(2).webp)
.avif)
.avif)
Most e-commerce brands don’t have a data problem. They have a clarity problem. You can track traffic, conversions, and add-to-carts. But when growth slows, those numbers don’t tell you what actually matters. You still don’t know why customers drop off, where the experience breaks, or why some return while others never come back.
For founder-led stores and small teams, this creates a familiar cycle. You keep optimizing campaigns, tweaking product pages, and running discounts, but results plateau because the underlying customer experience remains unclear.
Customer experience analytics closes this gap.
Instead of looking at isolated metrics, it helps you understand how customers move through your journey, what influences their decisions, and where they lose interest. In a market where experience drives retention, this shift from data to understanding is what separates steady growth from stagnation.
Key Takeaways
- CX analytics connects behavior, feedback, sentiment, and transactions to explain why customers drop off, not just where.
- It uncovers hidden friction points (checkout issues, weak messaging, poor post-purchase experience) that directly impact conversions and retention.
- Core metrics like CSAT, NPS, CES, churn rate, and CLV link customer experience to measurable business outcomes.
- The real value comes from mapping insights to the customer journey and turning them into continuous improvements.
- Brands that operationalize CX analytics can increase repeat purchases, improve LTV, and reduce reliance on discounts and acquisition.
What Is Customer Experience Analytics?
Customer experience analytics (CX analytics) is the practice of collecting and analyzing customer data across all interactions to understand and improve the overall customer experience.
But that definition only scratches the surface.
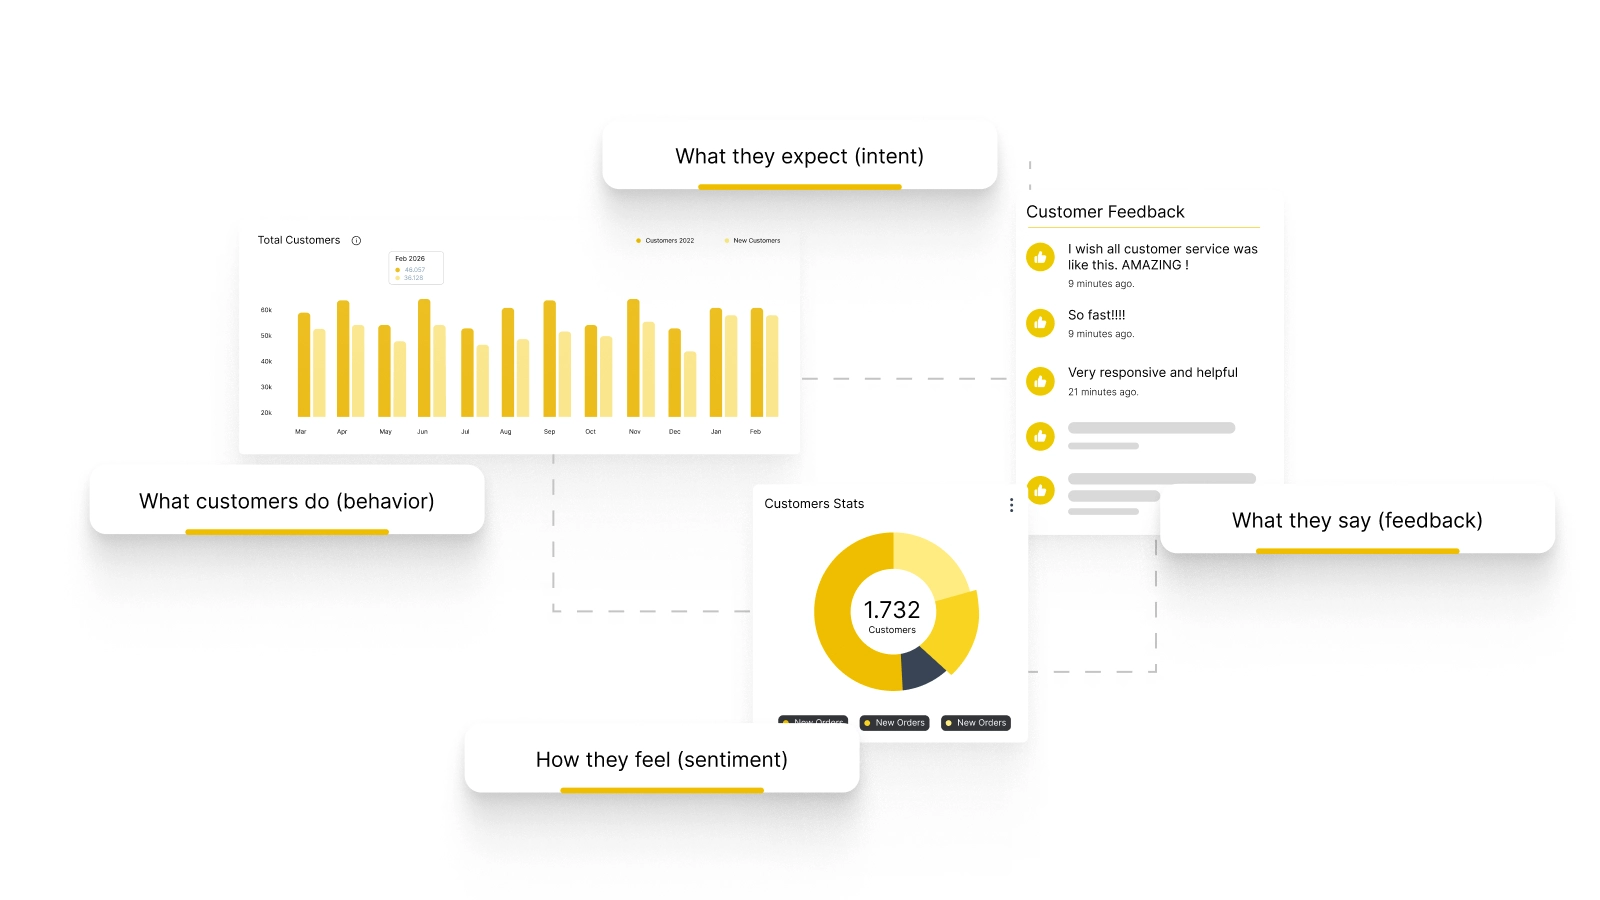
In reality, CX analytics connects multiple layers of data:
- What customers do (behavior)
- What they say (feedback)
- How they feel (sentiment)
- What they expect (intent)
Modern CX analytics systems unify structured and unstructured data, such as purchase history, clickstreams, reviews, and even support conversations, to create a complete picture of the customer journey. This is what makes CX analytics actionable.
Instead of answering: “How many users dropped off?”
It helps you answer: “Why did they drop off, and what can we fix?”
Also Read: How to Use Data Analytics to Optimize Your Loyalty Program
Why Customer Experience Analytics Matters for E-commerce
E-commerce journeys today are fragmented. A customer might discover your brand on Instagram, browse your website, leave, return through Google, read reviews, and finally purchase after an email reminder.
If you only track one part of that journey, you miss the bigger picture.
1. It Reveals the “Why” Behind Customer Behavior
Traditional analytics shows outcomes. CX analytics explains causes.
For example:
- High bounce rate → unclear messaging
- Cart abandonment → unexpected costs
- Low repeat purchases → weak post-purchase engagement
By analyzing behavior alongside feedback and sentiment, brands can understand what drives decisions.
2. It Identifies Hidden Friction Points
Many customer experience issues are not obvious.
They exist in moments like:
- Confusion on product pages
- Delays in checkout
- Lack of trust signals
- Poor communication after purchase
CX analytics helps uncover these subtle but critical problems across the journey.
3. It Improves Retention and Reduces Churn
Customer experience directly impacts retention. Research consistently shows that customers leave after poor experiences, and even a single bad interaction can push them toward competitors.
CX analytics helps brands identify dissatisfaction early and fix issues before they lead to churn.
4. It Enables Personalization at Scale
Customers expect relevant, timely experiences.
By analyzing behavior and preferences, CX analytics allows brands to:
- personalize recommendations
- tailor communication
- deliver contextual offers
This increases both engagement and conversion rates.
5. It Connects Experience to Revenue
The biggest advantage of CX analytics is that it links experience directly to business outcomes.
It shows how:
- Better experiences increase repeat purchases
- Smoother journeys improve conversion rates
- Satisfied customers drive referrals
This makes CX a measurable growth driver, not just a qualitative concept.

Key Components of Customer Experience Analytics
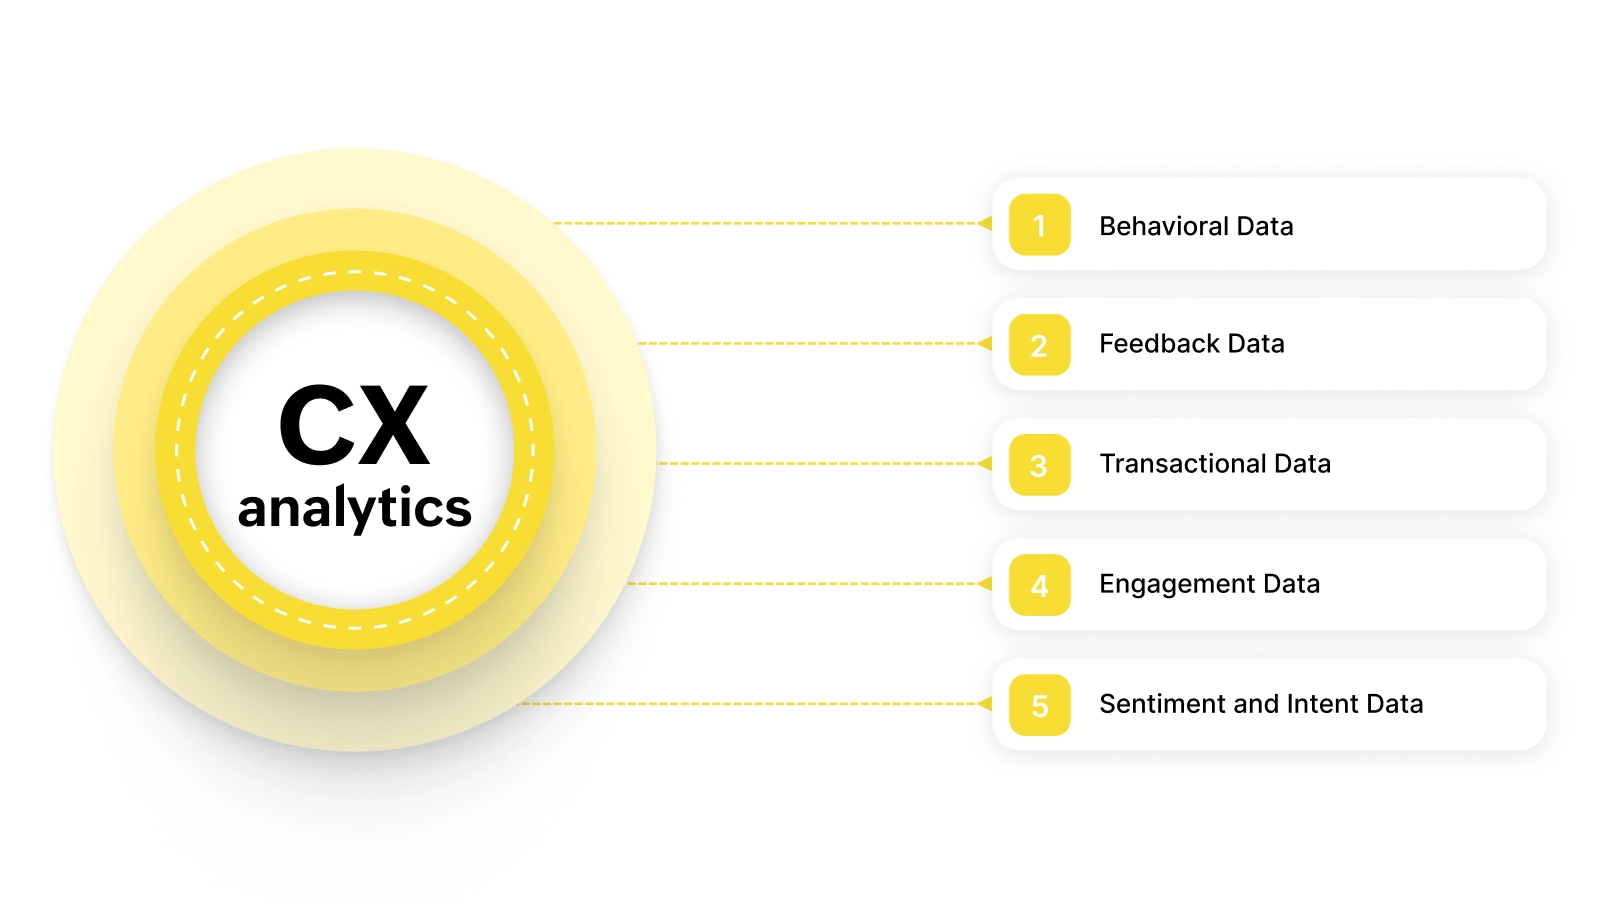
Customer experience analytics becomes useful only when you look beyond a single data source. Real insight comes from combining multiple types of data to understand not just what customers do, but why they do it.
1. Behavioral Data
Behavioral data shows how customers interact with your store in real time. This includes how they navigate pages, where they click, how long they stay, and where they drop off.
By analyzing these patterns, you can identify friction points in the journey, such as confusing product pages, weak CTAs, or checkout issues. It answers the question: What are customers doing on your site?
2. Feedback Data (Voice of Customer)
Feedback data captures what customers explicitly say about their experience. This includes reviews, survey responses like NPS or CSAT, support conversations, and social media comments.
Unlike behavioral data, this is often unstructured but highly valuable. It reveals frustrations, expectations, and unmet needs that are not always visible in numbers alone. It answers: What are customers telling you?
3. Transactional Data
Transactional data connects customer behavior to revenue. It shows how often customers purchase, how much they spend, and what products they prefer.
This layer helps you understand which experiences lead to higher-value outcomes and which ones don’t. It answers: how does customer experience impact revenue?
4. Engagement Data
Engagement data tracks how customers interact with your communication across channels like email, SMS, and campaigns.
It shows whether your messaging is effective, timely, and relevant. Low engagement often signals disconnect, while strong engagement indicates alignment with customer intent. It answers: are customers responding to your communication?
5. Sentiment and Intent Data
This is where CX analytics becomes more advanced. Using AI and pattern analysis, you can interpret how customers feel and what they are likely to do next.
Sentiment helps identify whether customers are satisfied, confused, or frustrated, while intent signals whether they are exploring, comparing, or ready to purchase. This allows you to move from reactive fixes to proactive improvements across the journey.
Key Metrics in Customer Experience Analytics
To make customer experience measurable, you need a mix of perception-based and business metrics. Looking at only one side, either experience or revenue, gives an incomplete picture. The real value comes from connecting how customers feel with how they behave.
1. Customer Satisfaction Score (CSAT)
CSAT measures how satisfied customers are after a specific interaction, such as a purchase, delivery, or support experience. It helps you evaluate individual touchpoints across the journey.
For e-commerce brands, CSAT is especially useful for identifying issues in areas like support quality, delivery timelines, and onboarding. A drop in CSAT often signals immediate friction that needs attention.
2. Net Promoter Score (NPS)
NPS measures how likely customers are to refer your brand to others. Unlike CSAT, which focuses on specific interactions, NPS reflects the overall relationship customers have with your brand.
A high NPS indicates strong trust and brand affinity, both of which are critical for long-term growth, referrals, and repeat purchases.
3. Customer Effort Score (CES)
CES measures how easy it is for customers to complete an action, whether it’s placing an order, resolving an issue, or finding information.
In e-commerce, effort directly impacts conversion and retention. If customers find it difficult to navigate your site or complete a purchase, they are more likely to drop off. Lower effort usually translates to a smoother experience and higher engagement.
4. Churn Rate
Churn rate shows how many customers stop engaging with your brand over time. It is one of the clearest indicators of experience breakdowns.
If customers are leaving after one or two interactions, it often points to issues in product experience, communication, or post-purchase engagement. Tracking churn helps you identify where the journey is failing.
Also Read: 10 Proven Churn Reduction Strategies for E-Commerce Brands
5. Customer Lifetime Value (CLV)
CLV measures the total revenue a customer generates over their relationship with your brand. It connects customer experience directly to financial outcomes.
When CX improvements lead to higher repeat purchases, better engagement, and increased order value, CLV increases. This makes it one of the most important metrics for evaluating long-term impact.
How to Implement Customer Experience Analytics (Step-by-Step)
.webp)
Collecting customer data is easy. Turning it into meaningful improvements is where most e-commerce teams struggle.
Customer experience analytics only works when it leads to clear actions across the journey. This requires a structured approach that connects data, context, and execution.
Step 1: Start With a Clear Objective
Before analyzing anything, define what you want to improve. Without a clear goal, data quickly becomes overwhelming and unfocused.
Your objective should be tied to a specific outcome, such as reducing cart abandonment, increasing repeat purchases, or improving conversion rates. This ensures that every insight you generate has a clear direction.
Step 2: Bring Customer Data Into One View
Most e-commerce brands operate with fragmented data across analytics tools, CRM systems, support platforms, and marketing channels.
To make sense of customer behavior, you need a unified view. Bringing data together across touchpoints allows you to see how customers move through your journey instead of analyzing isolated interactions.
Step 3: Map Data to the Customer Journey
Data becomes meaningful only when it is placed in context. Organize your insights across key stages of the journey, from awareness and consideration to purchase, post-purchase, and retention. This helps you understand not just what is happening, but where it is happening.
Step 4: Identify Patterns and Friction Points
Once your data is structured, focus on identifying patterns. Look for consistent drop-off points, repeated customer complaints, or behaviors that signal confusion or hesitation. At the same time, identify high-performing touchpoints that drive conversions or engagement. This step helps you separate symptoms from root causes.
Step 5: Translate Insights Into Actions
This is where most teams fall short. Insights alone do not improve customer experience unless they lead to changes.
Common actions include simplifying checkout flows, improving product page clarity, strengthening trust signals, or enhancing post-purchase communication. The goal is to remove friction and make the journey smoother at every stage.
Step 6: Build a Continuous Optimization Loop
Customer expectations evolve quickly, and so should your experience. Customer experience analytics is not a one-time exercise. It requires ongoing monitoring, testing, and iteration. Regularly revisiting your data ensures that your experience stays relevant and continues to improve over time.
Also Read: Customer Service Excellence: The Backbone of Ecommerce Loyalty
Common Challenges in Customer Experience Analytics
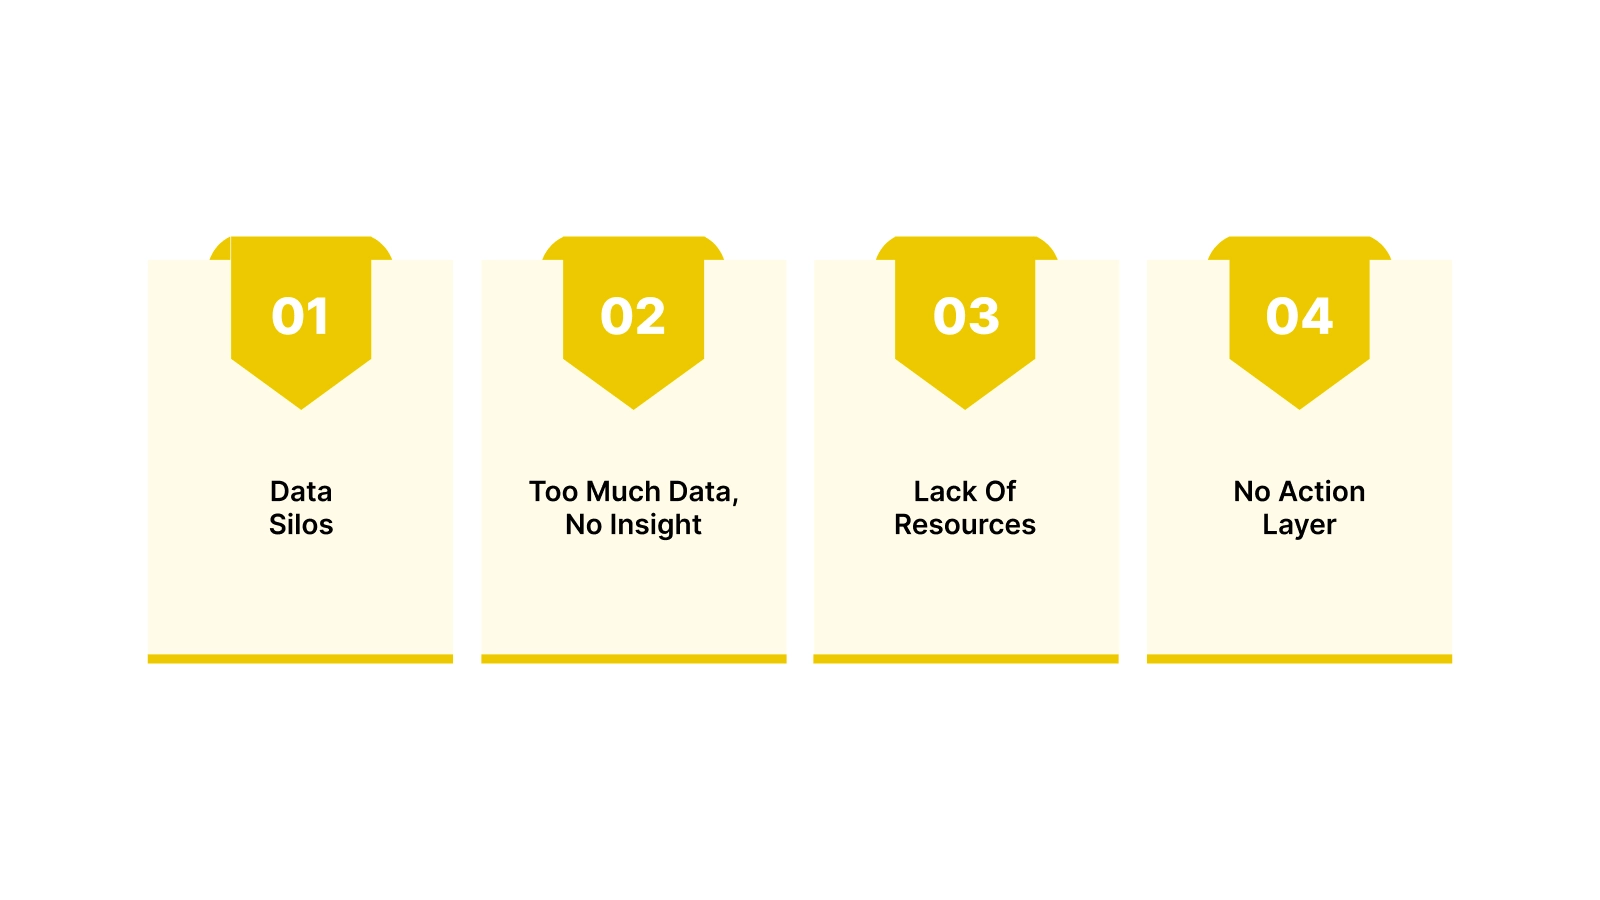
Even when e-commerce teams understand the importance of customer experience analytics, execution remains a challenge. The issue is rarely a lack of data. It is the inability to connect, interpret, and act on it consistently.
1. Data Silos Across Tools
Customer data is often spread across analytics platforms, CRM systems, support tools, and marketing channels. Each system captures a part of the journey, but none provide a complete view. This fragmentation makes it difficult to understand how customers actually move across touchpoints.
2. Too Much Data, Not Enough Insight
Most teams have access to dashboards filled with metrics, but translating those numbers into clear actions is not straightforward. Without context, data becomes noise. Teams end up tracking performance without understanding the reasons behind it.
3. Limited Time and Resources
Founder-led stores and small teams rarely have dedicated analysts. As a result, customer experience analysis becomes reactive rather than structured. Insights are either delayed or missed entirely.
4. No Clear Action Layer
Even when insights are identified, there is often no system in place to act on them. Fixes are implemented inconsistently, and improvements are not scaled across the customer journey. This gap between insight and execution is where most CX efforts break down.
Turn Customer Experience Insights Into Retention and Revenue with Nector
Most e-commerce brands already know where the problems are. Customers drop off after the first purchase, engagement declines over time, and opportunities like referrals and reviews remain underutilized.
The challenge is not identifying these gaps. It is solving them in a structured and scalable way.
Nector helps you act on customer experience insights by focusing on the most critical part of the journey: post-purchase engagement and retention.
With Nector, you can:
- Build customizable loyalty programs with points, tiers, and milestone rewards to drive repeat purchases
- Launch referral programs that turn your customers into acquisition channels
- Automate review collection to build trust and improve conversions
- Trigger behavior-based engagement across email, WhatsApp, and on-site experiences
- Track performance with real-time insights to continuously optimize your strategy
Instead of managing these efforts across disconnected tools, Nector brings everything into one system. This ensures your customers stay engaged, return more often, and increase their value over time.
Start your free trial on the starter plan or book a demo to see how you can turn customer experience into a consistent growth engine.
Conclusion
You can see where customers drop off, but fixing those gaps across the journey takes time, coordination, and the right systems. Without that, you stay stuck in a loop of optimizing campaigns, running discounts, and chasing short-term gains while retention and long-term growth remain unpredictable.
The goal isn’t just to understand your customers better. It’s to build an experience where customers move seamlessly from first purchase to repeat buyer to loyal advocate, without constant manual effort.
That’s what scalable growth looks like. More control, better visibility, fewer surprises, and consistent revenue from customers who keep coming back.
Nector helps you build that system. By bringing loyalty programs, referrals, and review automation into one platform, Nector enables you to act on customer insights at every stage of the journey. Instead of managing disconnected tools, you create a structured experience that keeps customers engaged, increases their value over time, and drives repeat revenue.
If you’re ready to move from analyzing customer behavior to actually improving it, book a demo with Nector and see how you can turn your customer experience into a long-term growth engine.
Frequently asked questions
What data is used in customer experience analytics?
Customer experience analytics combines multiple data sources, including behavioral data (clicks, page views), feedback (reviews, surveys), transactional data (purchases), and engagement data (email, SMS interactions). Combining these gives a complete view of the customer journey.
How is customer experience analytics different from traditional analytics?
Traditional analytics focuses on what happened, such as traffic or conversion rates. Customer experience analytics goes deeper by explaining why it happened, combining behavior, feedback, and sentiment to uncover the reasons behind customer actions.
How does customer experience analytics improve conversions?
By identifying friction points in the journey, such as confusing product pages or checkout issues, CX analytics helps brands make targeted improvements. This reduces drop-offs and increases the likelihood of customers completing their purchase.
How can small e-commerce teams implement CX analytics?
Small teams can start by focusing on one goal, such as improving repeat purchases or reducing cart abandonment. From there, they can unify basic data sources, map the customer journey, and act on clear insights instead of trying to analyze everything at once.
What are the most important metrics to track in CX analytics?
Some of the most important metrics include Customer Satisfaction Score (CSAT), Net Promoter Score (NPS), Customer Effort Score (CES), churn rate, and customer lifetime value. Together, these metrics connect customer experience with business performance.
.webp)