

.avif)
.avif)
Acquiring new customers is costly. According to Forbes, increasing customer retention by just 5% can boost profits by 25% to 95%.
Yet many e-commerce teams track only surface-level numbers like website traffic or new signups. These metrics don’t reveal how loyal your customers truly are.
Customer loyalty metrics show how much value each shopper brings over time and how effective your retention efforts really are. They guide smarter marketing, better product decisions, and stronger customer relationships.
This article breaks down the best metrics to measure customer loyalty in e-commerce, what they mean, how to calculate them, and how modern tools like Nector make it easier to track and act on them automatically.
Key Takeaways
- Loyalty metrics reveal how strong customer relationships truly are. Tracking behaviour, engagement, and retention shows what drives repeat purchases.
- Every business stage needs different metrics. Founder-led stores focus on simple KPIs like RPR and CLV, while growth-stage brands track ROI, tier upgrades, and engagement.
- Financial, behavioural, and program-health metrics work together for a 360° loyalty view. Each category highlights a different layer of retention and profitability.
- Automating loyalty analytics saves time and reveals trends faster. Tools like Nector connect metrics, customer actions, and revenue outcomes, all in one place.
Why Measuring Loyalty Metrics Matters
Most e-commerce brands spend far more on acquiring new customers than keeping existing ones. But loyal customers are the foundation of sustainable growth. They spend more, buy more often, and advocate for your brand without extra advertising costs.
Without tracking loyalty metrics, you can’t know whether your retention strategies are working.
For example:
- Are loyalty members spending more than non-members?
- How many customers return after their first purchase?
- Are your rewards driving real revenue or just discounts?
Metrics like repeat purchase rate, customer lifetime value, and redemption rate provide those answers. They help you identify what builds long-term trust and what causes churn.
For small teams, automating loyalty data collection saves time and removes guesswork. Platforms such as Nector bring these insights together, linking purchase behaviour, engagement, and program performance into one dashboard.
When you measure loyalty correctly, you stop relying on assumptions and start improving the numbers that matter most: repeat purchases, revenue per customer, and retention rate.
Now that we understand why measuring loyalty is essential, let’s look at the main types of loyalty metrics and how they work for e-commerce businesses of every size.
Also Read: 5 Key Metrics to Measure Customer Engagement vs. Customer Experience
Framework: Types of Loyalty Metrics
A single number can’t capture customer loyalty. It is the outcome of how customers behave, spend, engage, and respond to your brand over time.
To measure loyalty effectively, you need a balanced mix of financial, behavioural, engagement, and program-health metrics.
Each group plays a specific role. Financial metrics help you measure results, while behavioural and engagement metrics explain why customers stay or leave. Program-health metrics ensure your system stays effective over time.
In the next section, we’ll explore financial loyalty metrics, the foundation of measuring how customer loyalty directly drives e-commerce growth.
Also Read: Top 5 Customer Retention Metrics You Need to Track
Core Financial Metrics To Measure Customer Loyalty
Financial metrics show how loyalty impacts revenue and profit. They answer a critical question: Are your loyal customers truly driving growth?
Let’s look at the key financial metrics every e-commerce brand should track.
1. Customer Lifetime Value (CLV)
The total revenue a customer generates for your store during their entire relationship with your brand.
Why It Matters: CLV shows how valuable your repeat customers are. A high CLV means customers stay longer, buy more often, and cost less to retain.
How to Calculate:
CLV=Average Order Value (AOV) × Purchase Frequency × Average Customer Lifespan
Benchmark Insight: Brands with loyalty programs typically see a 15–25% higher CLV compared to those without.
Pro Tip:
Platforms like Nector automatically track CLV for loyalty and non-loyalty members, helping teams spot opportunities to improve retention and AOV without manual analysis.
2. Average Order Value (AOV)
The average amount a customer spends per transaction.
Formula:
AOV= Total RevenueNumber of Orders
Why It Matters: AOV reflects how effective your loyalty incentives are at increasing cart size. Tiered programs or reward milestones often encourage customers to spend more to unlock better rewards.
Example: A leading skincare brand (using Nector’s loyalty system) saw an 18% AOV uplift after introducing visible tier badges and “spend more to earn more” messaging.
3. Incremental Revenue from Loyalty Members
The additional revenue generated by loyalty members compared to non-members.
Why It Matters: It reveals the true ROI of your loyalty program, whether your members are genuinely more profitable.
How to Calculate:
Incremental Revenue=Revenue from Members−Revenue from Non-Members
Example: A travel gear retailer increased revenue 16x after integrating loyalty and referral points across channels, showing how loyal customers contribute disproportionately to total revenue.
4. Retention and Churn Rate
Retention rate measures the percentage of customers who continue buying from your store over a specific period. It reflects how successfully your business builds ongoing relationships rather than relying only on new customer acquisition.
Retention Rate Formula:
Retention Rate= Customers at End−New CustomersCustomers at Start100
Churn Rate Formula:
Churn Rate=100−Retention Rate
Why They Matter: Retention rate shows how many customers continue purchasing after their first order, while churn highlights those you lose. Tracking both helps you balance acquisition with retention efforts.
Insight: Even a 5% increase in retention can boost profits by 25% to 95%.
By linking purchase and engagement data, Nector helps e-commerce teams identify which actions increase repeat purchases and reduce churn automatically.
5. Cost to Serve (Loyal vs Non-Loyal Customers)
The marketing and operational costs to retain a loyal customer compared to acquiring a new one.
Why It Matters: It ensures your retention strategy remains profitable. Spending less to keep existing customers than to attract new ones is a healthy sign.
Financial metrics show the monetary outcome of loyalty. They prove whether your program contributes real value or just activity.
In the next section, we’ll explore behavioural and transaction metrics, the numbers that reveal how customers interact with your brand beyond revenue.
Also Read: How to Increase Repeat Customer Visits Using Loyalty Platforms
Behavioural and Transaction Metrics to Measure Customer Loyalty
Financial metrics show value. Behavioural metrics, on the other hand, show action. They measure how customers interact with your store, how often they return, and how they use your loyalty program.
Tracking these numbers helps you see how engaged your customers are between purchases, and how loyalty programs influence real buying behaviour.
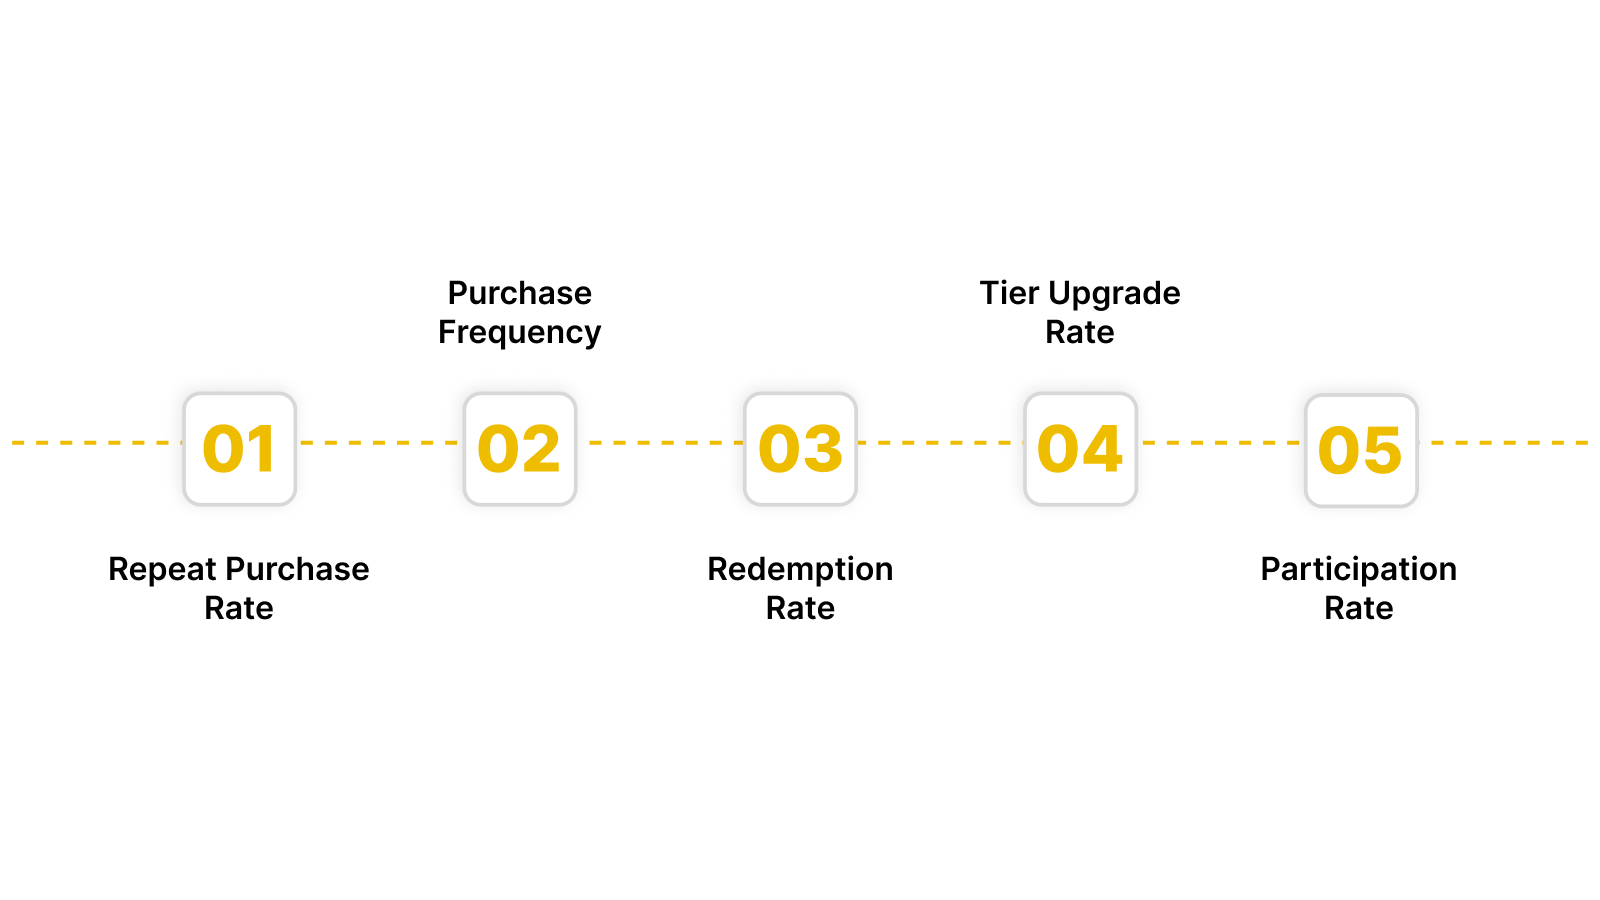
1. Repeat Purchase Rate (RPR)
The percentage of customers who make more than one purchase in a set period.
Formula:
RPR= Number of Repeat CustomersTotal Customers 100
Why It Matters: RPR is one of the simplest and most reliable indicators of customer loyalty. A higher rate means your retention strategy is working.
2. Purchase Frequency
How often customers buy within a given period (monthly, quarterly, annually).
Formula:
Purchase Frequency= Total OrdersUnique Customers
Why It Matters: It helps you identify how consistently customers engage. Loyal customers often buy more frequently, even when prices remain the same.
Pro Tip: Segment your customers based on frequency. Offer loyalty points or bonus rewards to those who are about to lapse.
3. Redemption Rate
The percentage of loyalty points or rewards that customers actually redeem.
Formula:
Redemption Rate= Redeemed PointsIssued Points 100
Why It Matters: A high redemption rate means your customers see real value in the program. Low rates often indicate rewards are confusing or feel unattainable.
A men’s fashion brand achieved a 55% redemption rate after adding visible progress bars and clear reward messaging. This simple visibility change encouraged members to redeem and return more often.
4. Tier Upgrade Rate
The percentage of loyalty members who move to a higher tier in a specific time frame.
Why It Matters: It shows how motivated customers are to engage more deeply. A steady increase in tier upgrades means your program offers desirable rewards and balanced progression.
Tip: Track upgrade rates alongside spending thresholds. If many customers stop just below the next tier, consider adjusting requirements.
5. Participation Rate (Loyalty Membership Rate)
The percentage of total customers who are active loyalty members.
Formula:
Participation Rate= Active Loyalty MembersTotal Customers 100
Why It Matters: It measures adoption, the first sign of success for any loyalty program. A growing participation rate shows that customers trust and value your reward system.
Platforms like Nector automatically track participation and activity data, giving teams real-time insights into how many members are active, redeeming, or at risk of churn.
Behavioural metrics help you understand what customers do. Next, we’ll explore engagement and advocacy metrics, numbers that capture why customers stay loyal and how they influence others to do the same.
Also Read: Common Customer Loyalty Mistakes to Avoid for E-commerce Success
Engagement and Advocacy Metrics to Measure Customer Loyalty
While behavioural metrics show what customers do, engagement metrics show how much they care. They measure emotional loyalty, how deeply customers interact with your brand, and how often they recommend it to others.
In e-commerce, these metrics reveal how customers help you grow through advocacy and trust.
1. Net Promoter Score (NPS)
NPS measures how likely customers are to recommend your brand to others.
How It Works: Customers answer a single question: “On a scale of 0 to 10, how likely are you to recommend us to a friend?”
Calculation:
NPS=%Promoters−%Detractors
Why It Matters: A higher NPS indicates strong emotional loyalty. It often predicts future purchase intent and word-of-mouth referrals.
According to Bain & Company, brands with a strong NPS grow revenue more than 2x faster than competitors.
2. Referral Conversion Rate
The percentage of referred customers who make a purchase.
Formula:
Referral Conversion Rate= Successful ReferralsTotal Referrals 100
Why It Matters: It shows how effectively your customers bring in new business. A strong referral rate means customers trust your brand enough to advocate for it.
3. Review Submission Rate
The percentage of customers who leave product reviews or feedback after a purchase.
Why It Matters: Reviews build social proof and indicate engagement beyond transactions.
When customers share experiences publicly, it strengthens brand trust and visibility.
Tip: Reward customers with loyalty points for verified reviews. It encourages participation while improving product credibility.
4. Tier Engagement Rate
The percentage of loyalty members engaging with tier-specific activities or rewards.
Why It Matters: It highlights how appealing your tier benefits are. If engagement drops at higher tiers, rewards may not justify the effort.
Example: A personal care brand increased engagement by 19.5% after aligning tier rewards with customer purchase cycles and adding birthday bonuses.
5. Social Engagement from Loyalty Members
The interactions generated on social platforms by loyalty members (likes, shares, mentions, UGC posts).
Why It Matters: Social engagement amplifies brand visibility and advocacy. Active loyalty members often become micro-influencers who share real experiences.
Engagement and advocacy metrics reveal how loyalty spreads beyond purchases. They show when customers evolve from repeat buyers to brand advocates.
Next, we’ll focus on program-health metrics, how to measure whether your loyalty program is performing sustainably.
Also Read: 7 Different Loyalty Strategies and Types of Loyalty That Actually Work

Loyalty Program Health Metrics
Even the best loyalty program can lose momentum if it’s not monitored closely. Program-health metrics help you track how well your loyalty system is performing, where engagement drops, and whether it’s generating measurable value.
These metrics are especially important for small teams, they ensure your loyalty engine runs efficiently without manual guesswork.
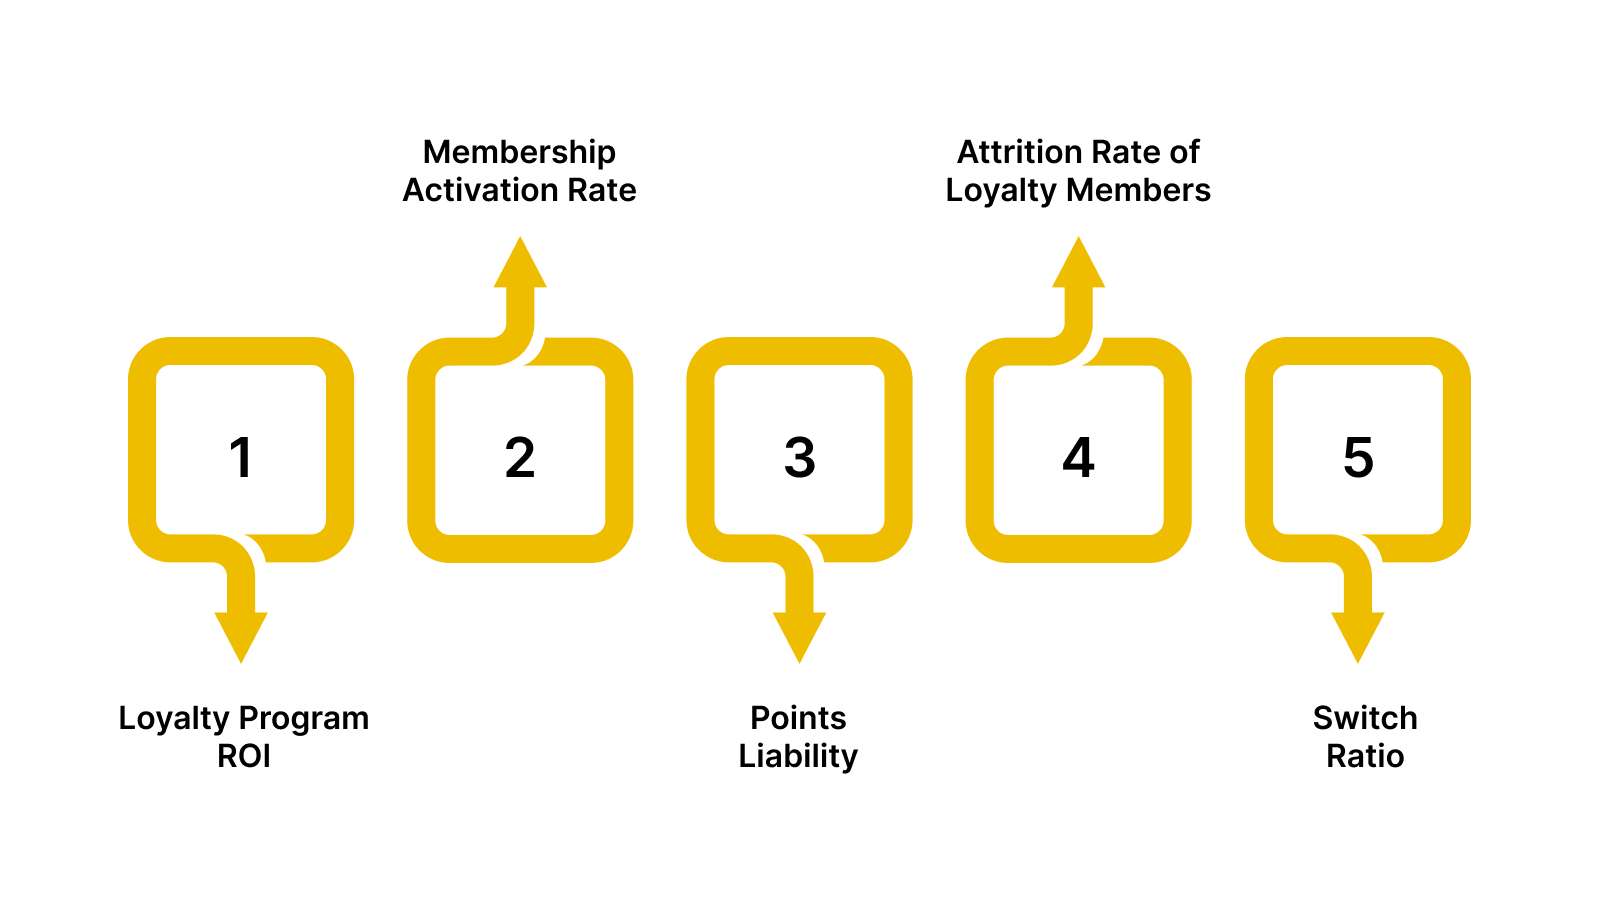
1. Loyalty Program ROI
The return on investment generated from your loyalty program compared to its operational cost.
Formula:
Loyalty ROI= Revenue from Loyalty Program−Program CostProgram Cost 100
Why It Matters: ROI shows if your loyalty system contributes more value than it costs. It includes revenue from repeat purchases, referrals, and redemptions.
2. Membership Activation Rate
The percentage of customers who join and make at least one loyalty-related action (purchase, referral, or review).
Formula:
Activation Rate= Active MembersTotal Members 100
Why It Matters: It distinguishes sign-ups from genuinely active participants. A strong activation rate means your onboarding and rewards communication work well.
Pro Tip: Send automated “first activity” reminders to new members to trigger early engagement.
3. Points Liability
The total value of loyalty points customers have earned but not redeemed.
Why It Matters: It helps you manage financial exposure and understand how engaged customers are.
If liability is high, redemption communication may need improvement.
Example: A lifestyle brand reduced its unused point liability by 22% after adding expiry reminders and visible balances in emails.
4. Attrition Rate of Loyalty Members
The percentage of loyalty members who stop engaging with your program over a defined period.
Formula:
Attrition Rate= Inactive MembersTotal Members 100
Why It Matters: It shows how many customers have lost interest or shifted to competitors. A steady rise in attrition indicates poor communication, low perceived value, or overly complex reward structures.
Nector Insight: With real-time dashboards, Nector tracks attrition trends and member activity, helping brands re-engage customers through automated reminders or personalized offers before they lapse.
5. Switch Ratio
The share of customer spending that loyalty members direct to your store versus competitors.
Why It Matters: A higher switch ratio means your loyalty program is successfully reducing churn and encouraging repeat purchases.
Tip: Track this ratio over time to gauge how well loyalty rewards protect your brand from competition, especially during discount seasons.
Also Read: 10+ Loyalty Program Gamification Ideas and Strategies
How to Choose the Right Metrics for Your Stage and Region
Not every e-commerce brand needs to track every metric from day one. The right metrics depend on your business stage, resources, and customer patterns.
A founder-led store, for instance, needs simpler, actionable metrics, while a growth-stage brand should track deeper loyalty insights.
Here’s a guide to help you prioritize effectively.
1. Early-Stage or Founder-Led Stores
Focus on simple, high-impact metrics that show immediate retention results.
Recommended Metrics:
- Repeat Purchase Rate (RPR)
- Redemption Rate
- Customer Lifetime Value (CLV)
- Participation Rate
They’re easy to track and directly linked to revenue. Small teams can measure them with minimal setup and get clear visibility into what keeps customers coming back.
Pro Tip: Set monthly goals for repeat purchases instead of complex KPIs. Consistency matters more than depth at this stage.
2. Growth-Stage E-Commerce Brands
Once you have a stable customer base, expand your metrics to evaluate long-term loyalty performance.
Recommended Metrics:
- Tier Upgrade Rate
- Incremental Revenue
- Engagement and Referral Rates
- Attrition Rate
They help identify patterns in customer behaviour and program scalability. Brands at this stage often start personalizing rewards, tracking ROI, and building tier-based programs for deeper retention.
Example: A leading nutrition brand saw a 44x ROI by linking loyalty tiers with social engagement metrics, tracking both short-term and long-term customer value.
3. Established or Enterprise E-Commerce Brands
For large-scale operations, loyalty metrics become strategic.
Recommended Metrics:
- CLV by Segment
- Program ROI
- Points Liability
- Switch Ratio
- Tier Engagement
They allow teams to analyze loyalty program efficiency and forecast retention-driven revenue across customer segments or product categories.
4. Regional Focus: India and Global Context
In India, repeat purchase rates are typically lower than global averages due to discount-driven buying patterns. Tracking redemption rate and engagement metrics helps brands measure loyalty beyond discounts.
Globally, metrics like CLV and NPS are crucial for mature markets where brand trust drives retention more than incentives.
Once you know which metrics to track, the next step is implementation, how to collect, analyze, and improve them efficiently.
Also Read: How to Increase Referral Traffic: 15 Proven Strategies That Actually Work
How to Track and Improve These Metrics Efficiently
Tracking loyalty metrics doesn’t have to mean adding manual work or extra software. With the right approach, small teams can monitor, analyze, and act on their loyalty data automatically.
Here’s how to make it efficient and actionable.
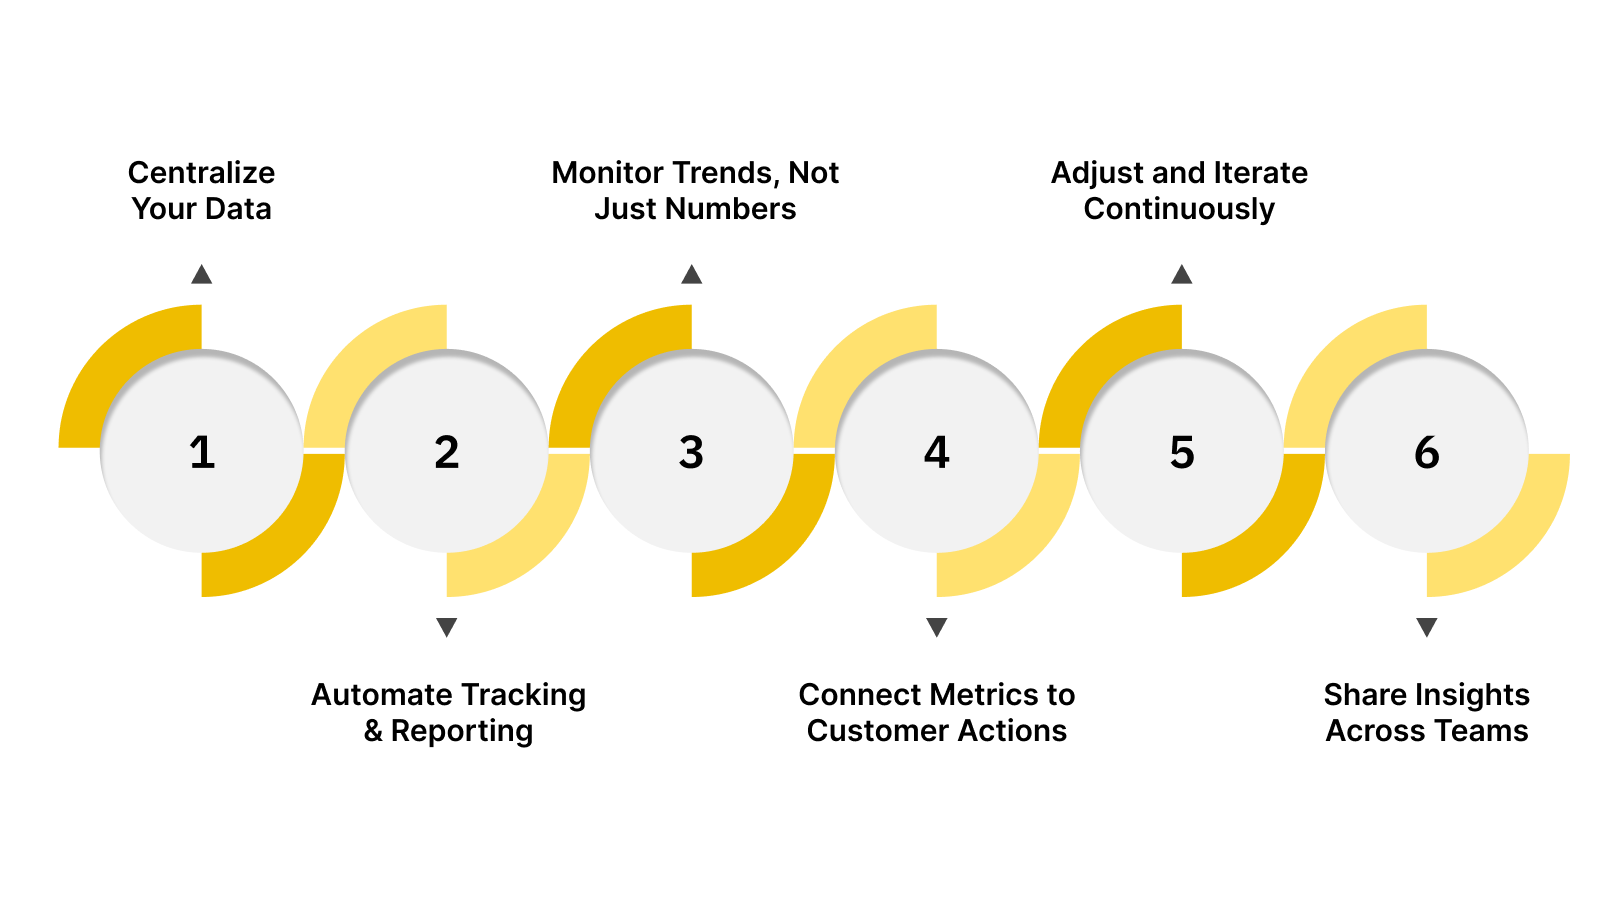
1. Centralize Your Data
Keep all customer and program data in one place, including purchase history, referrals, reviews, and engagement. This makes tracking easier and avoids fragmented insights.
Tip: Integrate your loyalty system with your e-commerce platform, email tool, and analytics suite to unify metrics.
Nector integrates directly with your commerce platform, marketing tools, and customer systems, so loyalty data moves automatically instead of being exported and stitched together manually. This allows teams to track metrics like CLV, redemption rate, referrals, and repeat purchases in real time, with reporting that reflects actual customer behavior.
2. Automate Tracking and Reporting
Manual tracking leads to errors and missed insights. Modern loyalty platforms automatically calculate metrics like CLV, redemption rate, or referral conversion.
A baby care brand automated its referral and review tracking, achieving a 45% referral completion rate with consistent reporting.
Automation lets your team focus on strategy instead of spreadsheets.
3. Monitor Trends, Not Just Numbers
Metrics tell stories over time. Look for changes in repeat purchase rates, CLV, and attrition instead of single data points. Trends reveal which campaigns or loyalty updates are working.
Pro Tip: Set quarterly benchmarks and compare results before and after introducing new program elements (like tiers or double-points campaigns).
4. Connect Metrics to Customer Actions
Numbers are only valuable when linked to behaviour. Use metrics to identify high-value customers and reward them with personalized offers.
Track what actions increase engagement, referrals, reviews, or purchases, and amplify them through automation.
Nector helps brands connect loyalty metrics directly to customer actions, showing exactly which triggers drive higher retention or AOV. This saves time and simplifies data-based decision-making.
5. Adjust and Iterate Continuously
Customer behaviour changes, and your program should adapt. Review your metrics quarterly to adjust thresholds, rewards, or communication.
Regular updates keep the program fresh and relevant.
6. Share Insights Across Teams
Metrics shouldn’t live only with the marketing team. Share insights with product, sales, and customer support teams to align decisions around loyalty and retention goals.
Tracking loyalty metrics effectively helps you evolve from guessing performance to knowing what drives growth.
Wrapping Up
Measuring customer loyalty isn’t about collecting endless data, it’s about tracking the metrics that truly reflect long-term relationships. Metrics like Customer Lifetime Value, Repeat Purchase Rate, and Redemption Rate show whether your retention strategy is working.
Others, such as Referral Conversion Rate and Program ROI, reveal how loyalty drives growth beyond purchases.When you track these numbers consistently, you gain the insight to make smarter decisions, adjust rewards, re-engage customers, and strengthen emotional loyalty.
And with the right tools, you can do it all without adding to your team’s workload.
Bring Your Loyalty Metrics to Life
Measuring loyalty is only the first step. The real impact comes from acting on those insights, rewarding the right behaviors, encouraging advocacy, and building trust at every stage of the customer journey.
Nector enables e-commerce brands to operationalize loyalty through three connected capabilities: customizable rewards that encourage repeat purchases, referral programs that turn satisfied customers into acquisition channels, and review systems that strengthen credibility with authentic social proof. Supported by integrations across your existing tools, these programs help transform loyalty data into consistent, revenue-driving actions.
Book a Demo to see how Nector helps you activate loyalty, referrals, and reviews, all within a single, scalable framework.
FAQs
How do I know which loyalty metrics are most important for my brand?
Start with metrics tied to your immediate goals. If you want more repeat orders, track Repeat Purchase Rate and CLV. If you aim for stronger engagement, focus on Referral Rate and Redemption Rate.
2. How often should I measure customer loyalty metrics?
Monthly tracking helps spot short-term trends, but quarterly reviews give clearer performance insights. Loyalty programs often need 60–90 days to show measurable change.
What is a good repeat purchase rate for e-commerce?
Across industries, 20–30% is a healthy average. Brands with effective loyalty programs often exceed 40%, especially when personalized rewards are visible and easy to redeem.
Do small e-commerce teams need complex analytics tools to track loyalty metrics?
No. Simpler tools can track key metrics automatically. Platforms like Nector centralize data from purchases, referrals, and reviews—removing the need for manual reports.
What’s the difference between loyalty program ROI and CLV?
ROI measures program profitability, while CLV measures individual customer value. Tracking both together shows whether your program creates profitable, long-term customers.


%201.webp)
Start Building Customer Retention That Lasts

